5.17.10.1. Revision History
| Version | Revision Date | Revision Notes |
|---|---|---|
| 0.1 | 2024.6.13 | Initial release |
| 0.5 | 2024.6.19 | Modify - Revised formatting and individual icon reference issues |
| 1.00 | 2024.7.1 | Adjusted document sentence semantics and finalized some module issues. |
| 2.00 | 2024.9.3 | Added and refined VtunerClient features and functionality |
5.17.10.2. X5 ISP Introduction
This chapter provides an overview of the ISP image quality (PQ) tuning tools provided by X5.
Introduction to ISP PQ Tuning Tools
The ISP PQ tuning toolset provided by X5 includes Tuning Server and VTunerClient, used for tuning modules, sensors, and related registers of the ISP running on FPGA or development boards. Tuning Server and VTunerClient adopt a server-client architecture and communicate via Ethernet using HTTP, TCP, or UART protocols. With the ISP PQ tuning toolset, you can preview and dump output video and images to verify tuning results.
Tuning Server
Tuning Server is a server that works with the ISP SDK on X5 boards or emulators, running as an executable named tuning-server. It monitors requests from VTunerClient. Upon receiving a request, the server updates corresponding operations based on the configuration in the request.
VTunerClient
VTunerClient is a client running on your local personal computer (PC) that provides a graphical user interface (GUI) for tuning ISP features. It is responsible for collecting data from Tuning Server and sending control requests to it.
Operating System Compatibility
To run Tuning Server and VTunerClient smoothly, we recommend that your development machine meets the following requirements:
| Component | Operating System |
|---|---|
| Tuning Server | ● Ubuntu 16 x64 or later ● Other Unix-like operating system |
| VTunerClient | ● Microsoft Windows 7 x64 or later ● Ubuntu 16 x64 with GUI or later |
Table 1.2‑1 OS Compatibility
Client-Server Connection Protocol
VTunerClient can connect to Tuning Server using the following protocols:
Transmission Control Protocol (TCP)
Supports image injection, real-time preview, dump, and statistics functions.
Software Distribution Package
The Tuning Server distribution package is named X5_ISP_Unified_Src_drv_<version>.tgz.
The VTunerClient executable files are:
VTunerClient-<version>-Win32-x86_64-<version>-Setup.exe for Windows OS
5.17.10.3. Tuning Server
This chapter provides information on how to set up Tuning Server, applicable to Tuning Server running on FPGA or emulators. If scripts are already integrated into your X5-based development device, this section may be skipped.
Setting Up Tuning Server
This section describes how to use the CLI tool t_install to set up Tuning Server running on FPGA or emulators.
Prerequisites
The target operating system meets the requirements listed in Operating System Compatibility.
The Tuning Server distribution package listed in Software Distribution Package is available.
Procedure
Power on the X5 development board.
Edit the script t_install/interact/Maintain/Edition/units.sh as needed:
export TUNE_EDITION_OPTION_DRIVER_UNITS=1 export TUNE_EDITION_OPTION_XML=1
export TUNE_EDITION_OPTION_FILESYSTEM=1 export TUNE_EDITION_OPTION_OS=1
export TUNE_EDITION_OPTION_TRANSMIT_HTTP=1
export TUNE_EDITION_OPTION_TRANSMIT_TCP=1
# export TUNE_EDITION_OPTION_TRANSMIT_UART=1
Note: If environment variable settings in the units.sh script are updated after Tuning Server installation, you need to restart the interactive menu and recompile the Tuning Server to activate the updated settings.
For information about supported connection protocols, refer to Client-Server Connection Protocol.
Run the following command to launch the interactive menu:
./t_install/install.sh -i
The current level options will then be displayed. For full menu tree information, refer to Menu Tree.
To select an option, enter the ID before the option and press Enter.
To go back to the previous level, enter the ID before Quit or enter q and press Enter.
(Emulator only) Select Maintain > Edition > units_emulator to enter emulator mode. Skip this step if Tuning Server will run on FPGA.
Select Maintain > Environment > Install Builtin Tools to load toolkits and install tools such as CMake and Ninja.
Select platform and build SDK as follows:
If Tuning Server will run on FPGA, select Install > Module > SDK Units > Platform > FPGA > Quit > Install
If Tuning Server will run on emulator, select Install > Module > SDK Units > Platform > C Model > Quit > Install
Select Install > Module > SDK Units > Sensor > $sensor_device to choose the sensor, where $sensor_device refers to the sensor you want to tune.
Note: If you want to change the sensor, you need to rebuild the server by repeating steps 6 to 8.
Select Install > APP > Tuning Server to build the Tuning Server.
Outcome
Tuning Server is successfully built and installed.
Running Tuning Server
This section describes the steps to run Tuning Server after setup.
Prerequisites
Ensure Tuning Server has been set up according to the instructions in Tuning Server.
Procedure:
Run the following command to launch the interactive menu:
./t_install/install.sh -i
The current level options will then be displayed. For full menu tree information, refer to Menu Tree.
To select an option, enter the ID before the option and press Enter.
To go back to the previous level, enter the ID before Quit or enter q and press Enter.
Select Run > Server to run Tuning Server.
The default HTTP port is 8080 and is not configurable.
The default TCP control port is 2000, image injection port is 2001, raw data dump port is 2002, statistics port is 2003, and YUV stream port is 45678. For information on customizing TCP ports, refer to Customizing TCP/UART Timeout and Dump Configuration.
5.17.10.4. VTunerClient
This chapter provides guidance on using VTunerClient for ISP image quality tuning.
Installation and Launch
This section guides you through installing and launching VTunerClient.
Typically, the workflow is as follows:
Install VTunerClient.
Launch the VTunerClient workspace.
Switch the VTunerClient workspace to the ISP Tuner view.
Create an ISP project.
Configure the connection to Tuning Server.
Installing VTunerClient
Install VTunerClient on your local personal computer (PC).
Prerequisites
The target operating system meets the requirements listed in Operating System Compatibility.
The VTunerClient executable file is available.
Installation Steps
Run the VTunerClient executable to start the installation wizard.
In the “Install VTunerClient” dialog box, click “Yes”.
On the welcome page of the VTunerClient installation wizard, click “Next”.
On the “License Agreement” page, read the license agreement.
To accept the agreement, select “I accept the terms of the license agreement”, then click “Next”.
On the “Choose Destination Location” page, click “Browse” to select the target directory for installing VTunerClient, then click “Next”.
On the “Start Copying Files” page, review the installation directory.
If the selected installation directory is incorrect, click “Back” and return to step 6.
If the installation directory is correct, click “Next”.
Wait for the installation to complete.
On the installation completion page, click “Finish”.
Installation Outcome
VTunerClient has been installed.
If you are using a Windows system, a VTunerClient shortcut will be created on the desktop.
Next Steps
To uninstall VTunerClient, run <installation_directory>/uninstall to launch the uninstall wizard and follow the instructions to complete the uninstallation.
Launching the VTunerClient Workspace
Prerequisites
Ensure VTunerClient has been installed according to the instructions in Installing VTunerClient.
Steps
Launch VTunerClient
If you are using a Linux system, run ./ide/vtunerclient<version> in the terminal.
If you are using a Windows system, use one of the following methods:
Select Start > X5 > VTunerClient <version>.
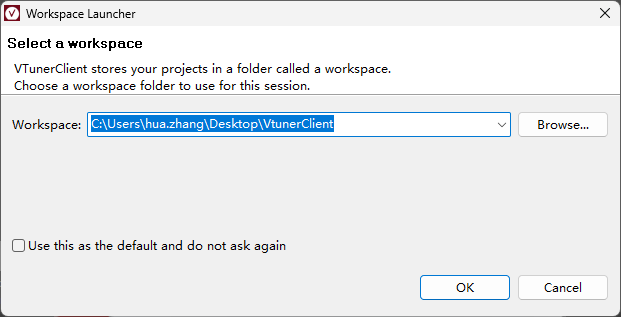
Double-click the VTunerClient shortcut on the desktop. In the pop-up “Workspace Launcher” dialog box, select a workspace and click “OK”.
If the selected workspace does not exist, it will be created automatically. As shown below:
Launch Outcome
• The VTunerClient workspace has been created.
• By default, the workspace displays in the Resource view.
Switching to ISP Tuner View
This section switches the VTunerClient workspace to the ISP Tuner view.
Prerequisites
Ensure the VTunerClient workspace has been launched, as described in Launching the VTunerClient Workspace.
Steps
In the top menu bar, select Window > Open Perspective > Other.
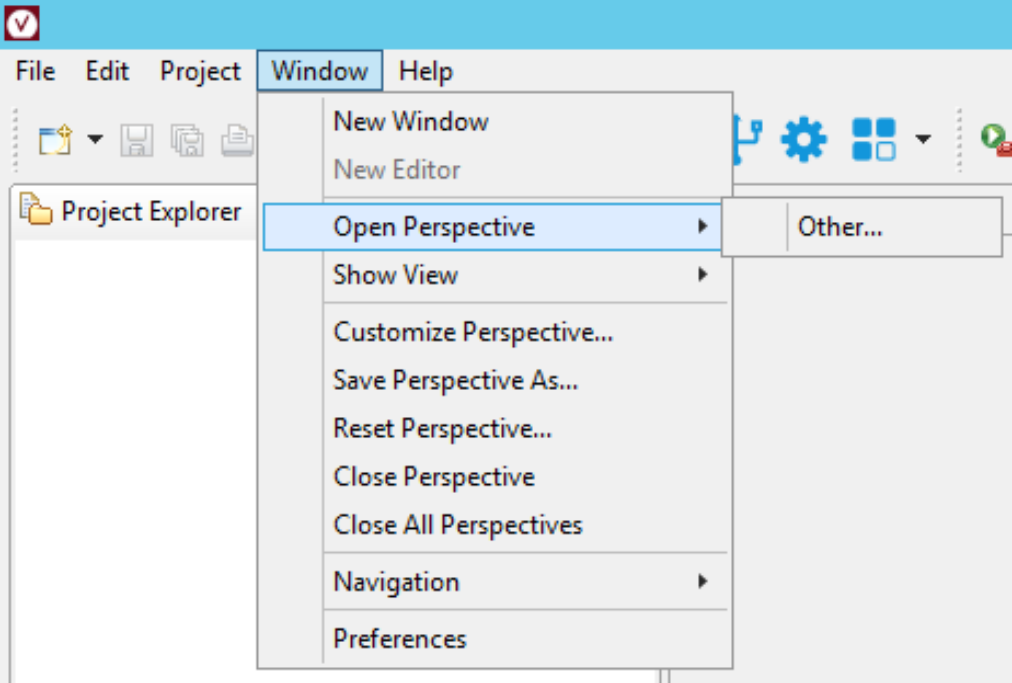
Figure 3.1‑1 Select Window > Open Perspective > Other
In the pop-up “Open Perspective” window, select “ISP Tuner”, then click “OK”. Alternatively, double-click “ISP Tuner”.
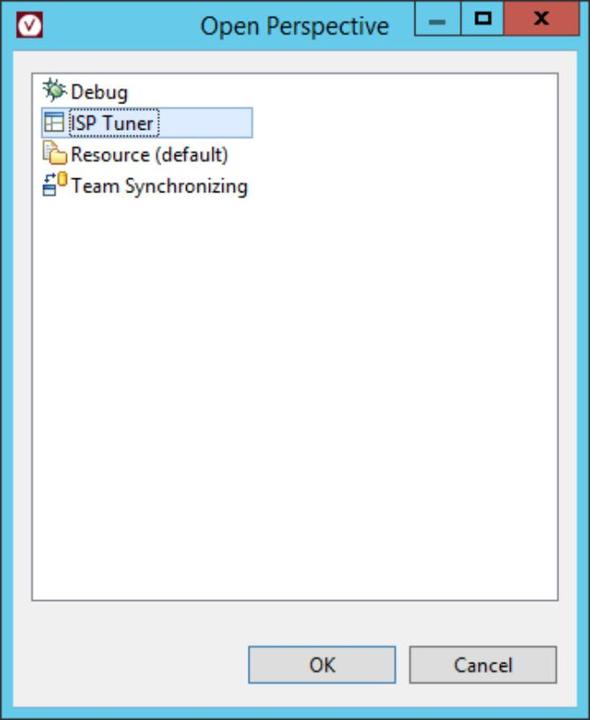
Figure 3.1‑2 Select ISP Tuner Perspective
Outcome
The VTunerClient workspace has been switched to the ISP Tuner view.
Creating an ISP Project
This section describes how to create an ISP project. Each ISP project contains a set of settings for ISP tuner features.
Prerequisites
Ensure the VTunerClient workspace is displayed in the ISP Tuner view, as described in Switching to ISP Tuner View.
Steps
In the top menu bar, select File > New > Project.
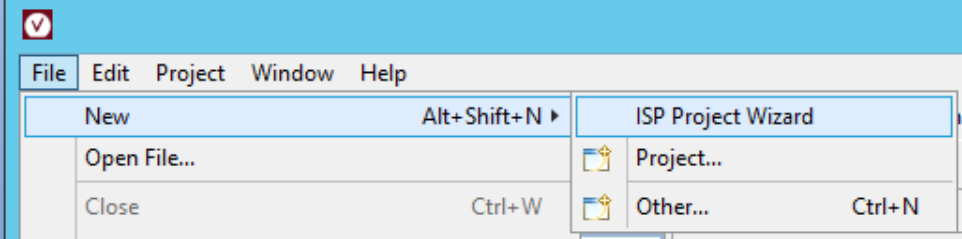
Figure 3.1‑3 Select File > New > Project
In the pop-up “New Project” window, select ISP > ISP Project Wizard, then click “Next”. The ISP project window will appear.
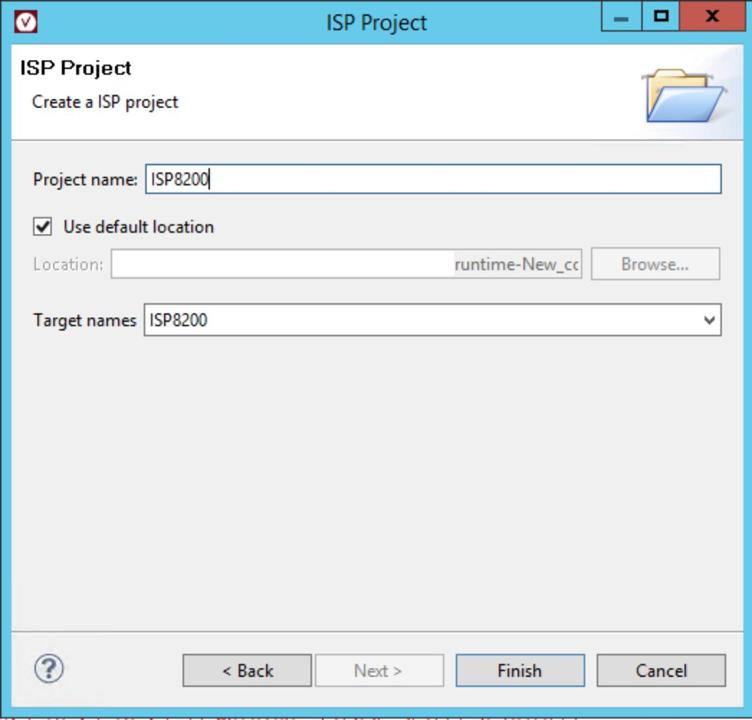
Figure 3.1‑4 Example of Creating an ISP Project
In the “Project name” text box, enter the name of the project to be created. Project names can only contain letters, numbers, and underscores. Other special characters are not supported.
To create the project in the default location, select the “Use default location option”. To customize the target location, clear this option, click “Browse” to the right of Location, and select the desired location.
From the “Target names” drop-down list, select a tuning template.
Click “Finish” to create the project.
Outcome
• The ISP project has been created and listed in the project resource browser view.
• A folder with the same name as the project has been created at the specified location.
Configuring Connection to Server
This section specifies the IP address and port of the Tuning Server and connects VTunerClient accordingly. HTTP and TCP connections require an IP address, while UART connections require a port.
Prerequisites
• VTunerClient workspace is displayed in the
view. For instructions, refer to Switching to ISP Tuner View.
• For Tuning Server configuration, refer to [Tuning Server](#_Tuning Server_1).
Procedure
In the toolbar, click
 . The Server Configuration dialog box will appear.
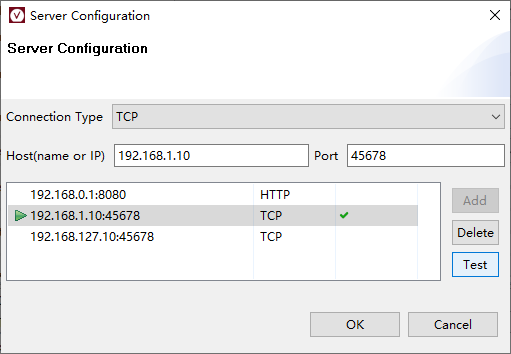
Figure 3.1‑5 Establishing Connection Between Tuning Server and VTunerClient via HTTP/TCP
From the “Connection Type” drop-down list, select the protocol to be used between VTunerClient and Tuning Server.
For supported protocols, refer to Client-Server Connection Protocol.
If the connection type is set to TCP, perform the following steps:
In the “Host (name or IP)” and “Port” text boxes, enter the board-side IP address and port number of the Tuning Server. The port number is “45678”.
Click “Add” to add the Tuning Server to the host list.
If an exclamation mark (!) appears to the right of the host information, access to the Tuning Server has failed. In this case, troubleshoot the connection error and retry.
If a green checkmark (√) appears to the right of the host information, the Tuning Server is accessible.
Click “OK” to complete the configuration.
Outcome
The host address of the Tuning Server is displayed in the status bar of the VTunerClient workspace. The indicator light shows whether the host is accessible.
A green indicator light indicates the Tuning Server is accessible.
A red indicator light indicates the Tuning Server is not accessible.

Figure 3.1‑7 Connection Status Icon
Note: The PC and development board must be on the same network segment to communicate.
Debugging Workspace
This section provides an overview of the VTunerClient workspace user interface (UI).
ISP Tuner View
The ISP Tuner view contains the following components required for tuning ISP features, as shown in Figure 3.2‑1.
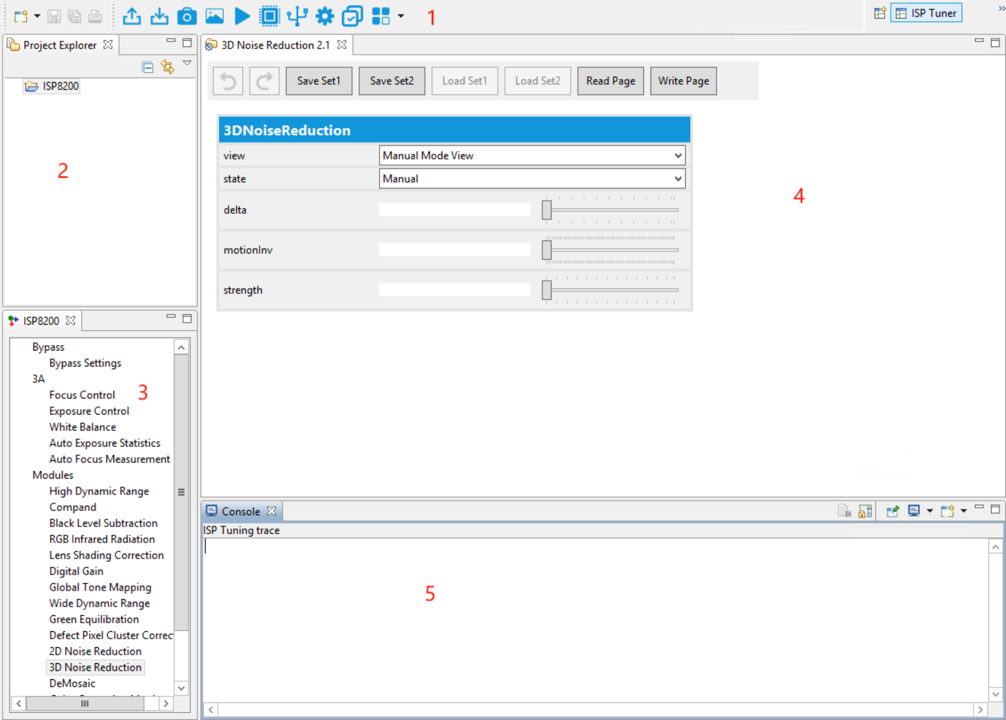
Figure 3.2‑1 Main Page of ISP Tuner Tool
Toolbar
The table describes key buttons in the toolbar of the ISP Tuner view (Area 1 in Figure 3.2‑1)
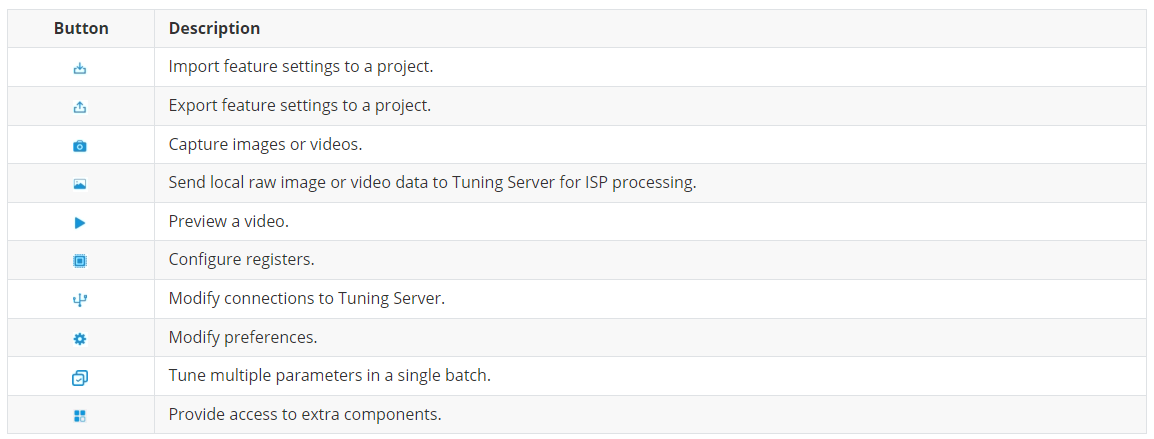
Table 3.2‑1 Description of Key Functions in ISP Tuner View
Additional Components
This section introduces additional components available in the dropdown list under the  button in the ISP Tuner view toolbar.
Json/Xml Edit: A simple .json or .xml file editor.
Calibration Tool: A calibration tool based on MATLAB Runtime (MCR) 2023a.
To use the calibration tool, MCR2023a must be installed on the same personal computer (PC) as VTunerClient. For more details, refer to the Calibration Tool User Guide provided in the ISP software distribution package.> Calibration tools are only available on Windows.
AWB Tool: A tool that can visualize calibration data and statistics.
The AWB Tool is only available on Windows. For more information about the AWB Tool, see 3.2.1.2.1.
AWB Tool
The Auto White Balance (AWB) tool provides AWB calibration data and statistics, such as the average RGB values of valid white points and the proportion of white points within each color temperature range.
The AWB tool reads calibration data and statistics from the Tuning Server, plots the data on charts, and lists the statistics in tables. Each time the “Update” button is clicked, the AWB tool reads data from the Tuning Server and refreshes the dumped image, charts, and tables accordingly.
Note: The AWB tool only displays images dumped from the streaming port when the image dump function is enabled. If this function is disabled, the AWB tool will generate and display a pure white image. For information on how to enable the image dump function, see Customize TCP/UART Timeout and Dump Configuration.
Prerequisites for Using the AWB Tool
• VTunerClient is connected to the Tuning Server.
• Real-time data streaming has been started, as described in Configuring Live Preview.
• The AWB module and exposure statistics module are available in the current project.
Statistics Window Grid
The AWB tool provides a window to display the dumped image, divided into a 32x32 grid corresponding to the 32x32 statistical elements, as shown in Figure 3.2‑2.
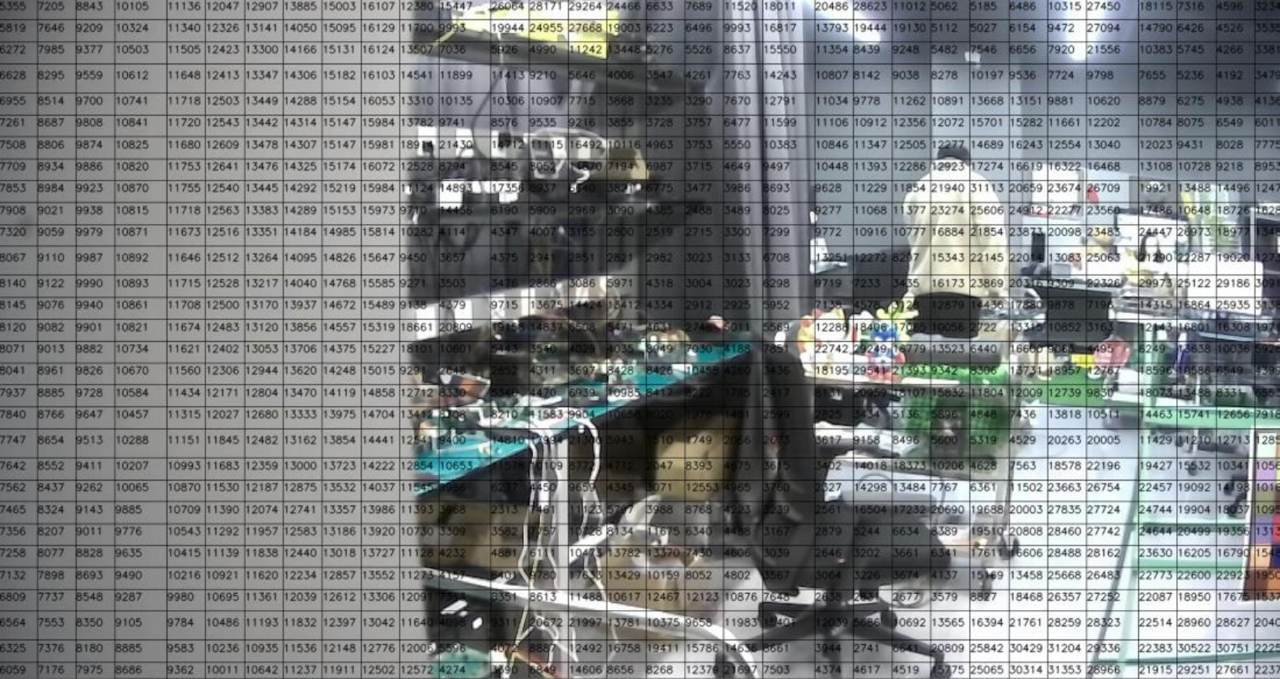
Figure 3.2‑2 32x32 Blocks Window
You can select a block to display its local information in the AWB statistics window. Only one block can be selected at a time.
After selection, the block is highlighted with a yellow border, as shown in Figure 3.2‑3.
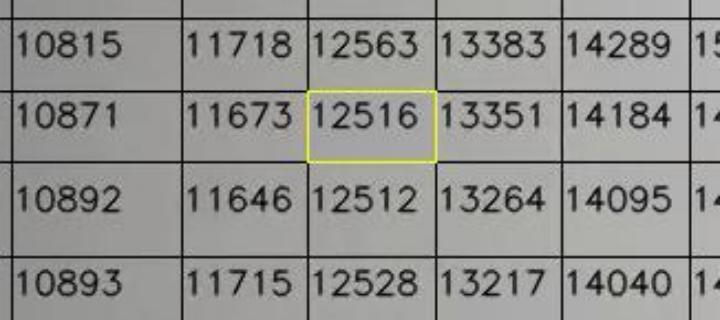
Figure 3.2‑3 Block Selection
The corresponding white point in the AWB statistics window is also highlighted in yellow, as shown in Figure 3.2‑3.
You can click the selected block again to deselect it. The number in each block represents the average value of the selected item in the AWB statistics window.
AWB Statistics Window
The AWB tool provides a window to display statistics. Only white points participating in AWB statistics are counted.
AWB Statistic includes a table and a chart.
The table consists of the following sections: Global, SelectZone, and Weight. Each value in the table represents the average value for the corresponding channel.
Global lists statistics for the entire image.
SelectZone lists statistics for the block selected in the block window. If no block is selected, the SelectZone section remains empty.
Weight lists the weights of light sources. The sum of all weights must equal 1. If all weights are 0, ensure that the AWB module is enabled.
To display only the information of interest, you can select an option from the Select Item dropdown list.
To refresh the table and chart, click the “Update” button. However, all previous changes will be discarded after refreshing.
The image shown in Figure 3.2‑2 can be imported via the “Load Image” function for convenient reference to each statistical block’s data results.
The figure below, Figure 3.2‑4, illustrates the distribution of white points and light sources.
If the AWB module supports the
confidenceThresholdparameter, you can adjust the size of each light source by dragging its circle. This will update and send the newconfidenceThresholdto the Tuning Server, possibly causing changes in the image and statistics. When adjusting the size of light sources, note the following constraints:
The circles of any two light sources must not intersect.
The adjusted circle size must not be smaller than the initial size.
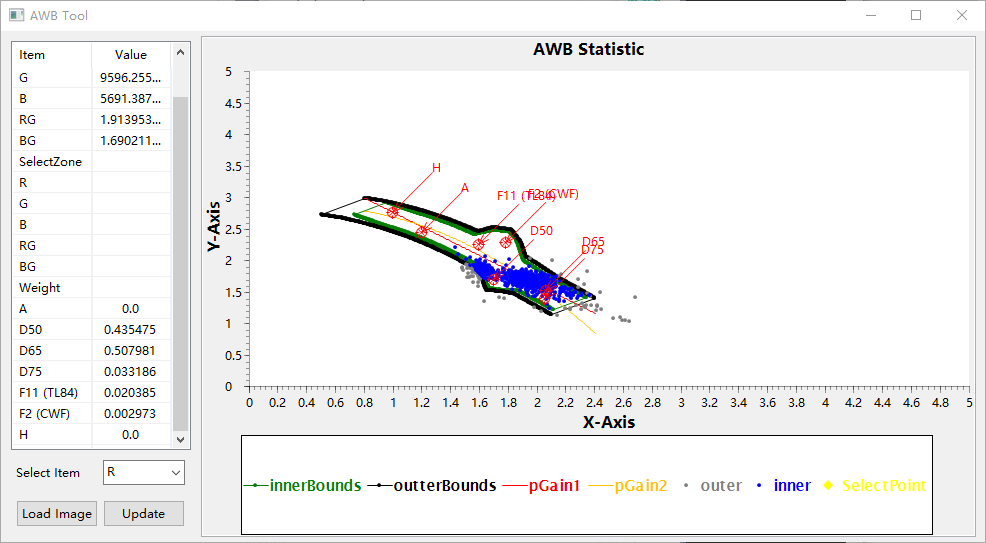
Figure 3.2‑4 AWB Statistic Window
Views
Table 3.2‑2 describes the views available in ISP Tuner.
| Button | Description |
|---|---|
| Project ExplorerMain page of ISP Tuner tool (No. 2) | Lists the projects in the current workspace. |
| FeaturesMain page of ISP Tuner tool (No. 3) | Lists the feature modules that can be tuned for the project selected in the Project Explorer view. The label of this view varies with the tuning template of the selected project. |
| DetailsMain page of ISP Tuner tool (No. 4) | Shows the settings of the feature module selected in the Features view. The label of this view varies with the selected module. |
| ConsoleMain page of ISP Tuner tool (No. 5) | Prints logs in real time. |
Table 3.2‑2 Views in the ISP Tuner Perspective
Project Resource Preview
The Project Resource view provides a hierarchical view of the projects in the current workspace, as shown in Figure 3.2‑5.
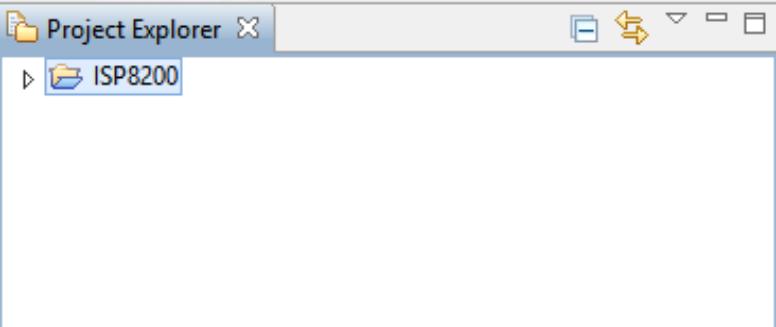
Figure 3.2‑5 Project Explorer View
Feature Preview
The Feature Preview displays a list of tunable feature modules.
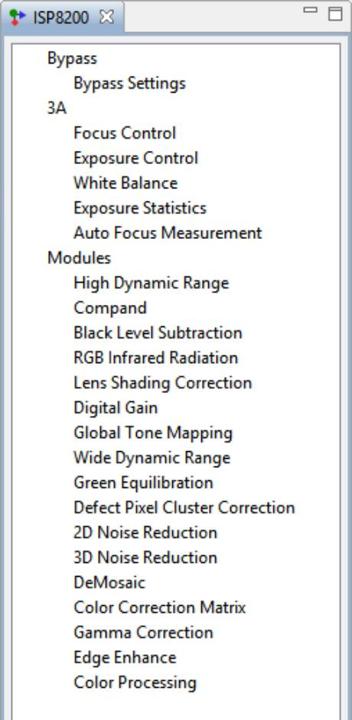
Figure 3.2‑6 Example of Feature List
Module Details
Displays the settings available for tuning of the selected feature module in the Features view, with a control bar at the top. Settings vary depending on the specific feature. Figure 3.2‑7 shows an example of the detail view for the 3D Noise Reduction module.
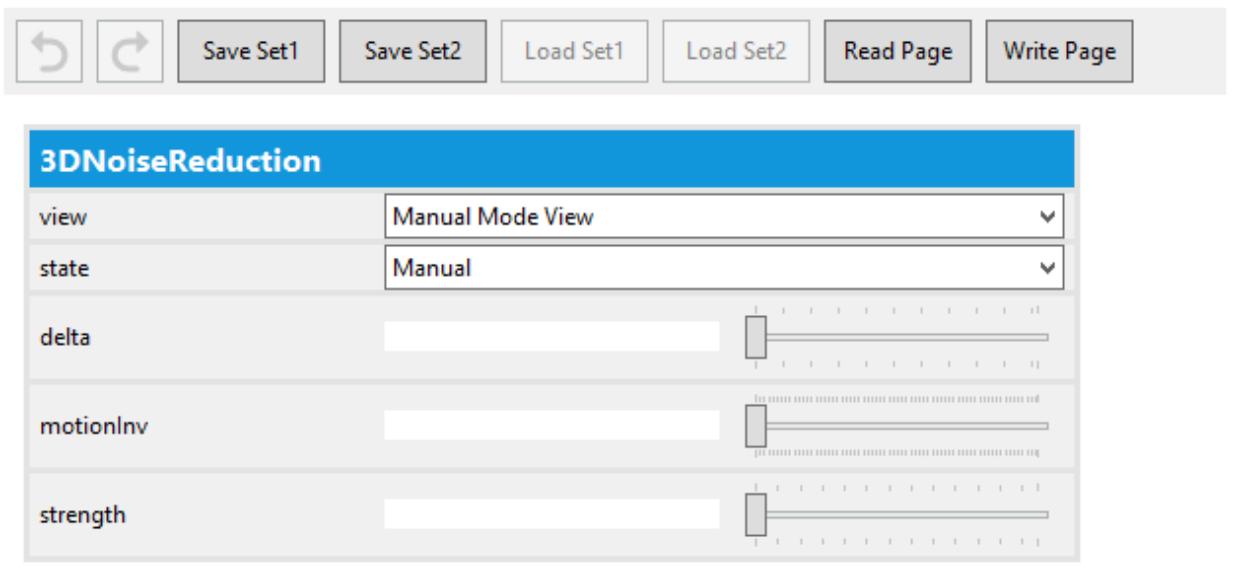
Figure 3.2‑7 Example of Details View
Control Bar
The Module Details view provides a control bar at the top. The buttons in the control bar are described in Table 3.2‑3.

Figure 3.2‑8 Example Control Bar with the Write Page Button in the Details View

Figure 3.2‑9 Example Control Bar with the Write To Manual Button in the Details View
| Button | Name |
|---|---|
| (Undo) | Undo or redo an action. The undo/redo function is supported for each module separately. For each module, you can undo and redo a maximum of 10 updates. Note: New updates are stored at the end of the history, with intermediate steps if necessary. For |
| (Redo) | example, the initial value of Strength is 0, and is then sequentially changed to 2, 4, 6, and 8. Clicking the Undo button repeatedly until the value is set back to 2 enables both the Undo and Redo button, as we can track backward to 0 and forward to 4, 6, and 8. At this point, if Strength is set to 5, this update is added to the end of the history, after an intermediate record 8 -> 2. The redo button is then disabled because the last step has been reached, and the Undo button can track backward as 5 -> 2 -> 8 -> 6 -> 4 -> 2 -> 0. |
| Save Set1 | Save the parameter settings in the current view to asset1. |
| Save Set2 | Save the parameter settings in the current view to asset2. |
| Load Set1 | Load parameter settings from set1. |
| Load Set2 | Load parameter settings from set2. |
| Read Page | Read all the settings of the parameters in the current view from the Tuning Server. |
| Write Page | Write all the parameter settings in the current view to the Tuning Server. |
Table 3.2‑3 Control Bar Buttons in the Details View
Note: The “Write To Manual” function requires selecting the “Current Value View” option in the specific module’s View section. This button will then appear on the tool side. This function is useful for debugging, allowing the current Auto-mode parameters to be written into Manual mode, enabling troubleshooting and issue localization by modifying fewer Manual parameters.
Parameter Types
The parameter details support five types of parameters: Boolean, Integer/Float, Option, Matrix, and Curve. The controls used to configure each parameter type vary.
Boolean Parameters
Each Boolean parameter is configured by selecting or clearing a checkbox, as shown in Figure 3.2‑10.

Figure 3.2‑10 Boolean Parameter Example
Integer/Float Parameters
Each integer/float parameter is configured by entering a value in the text box or dragging the slider on the right, as shown in Figure 3.2‑11. Once the slider is dragged, the value in the text box updates accordingly, and vice versa.
The supported value range is displayed as a tooltip when you hover over the slider, with the left and right endpoints representing the minimum and maximum values, respectively.

Figure 3.2‑11 Integer/Float Parameter Example
Option Parameters
Each option parameter is configured by selecting a value from a dropdown list, as shown in Figure 3.2‑12.

Figure 3.2‑12 Option Parameter Example
Option: view
If the feature module provides a view option, it can be used to switch between Manual Mode View, Auto Mode View, and Current Value View, as follows:
If Manual Mode View is selected, the Details view displays manual configuration parameters.
If Auto Mode View is selected, the Details view displays automatic configuration parameters.
If Current Value View is selected, the Details view displays the effective values of the module after interpolation in Auto mode.
The Current Value View is read-only. However, you can click the “Write To Manual” button in the control bar to assign the values in the current view to the manual parameters on the Tuning Server.
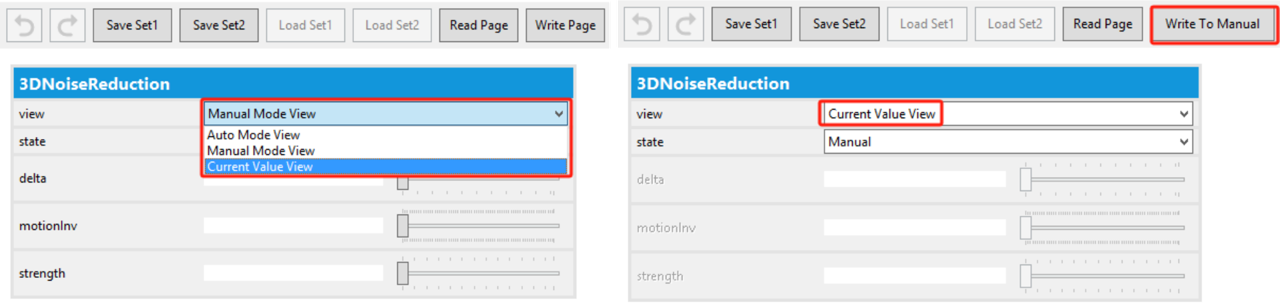
Figure 3.2‑13 Examples of Option view
Option: state
If the feature module provides a state option, it can be used to enable or disable the module, as follows:
If Manual is selected, the module operates in manual mode. Only the manual mode view is editable.
If Auto is selected, the module operates in auto mode. Only the auto mode view is editable.
If Off is selected, the module is disabled.
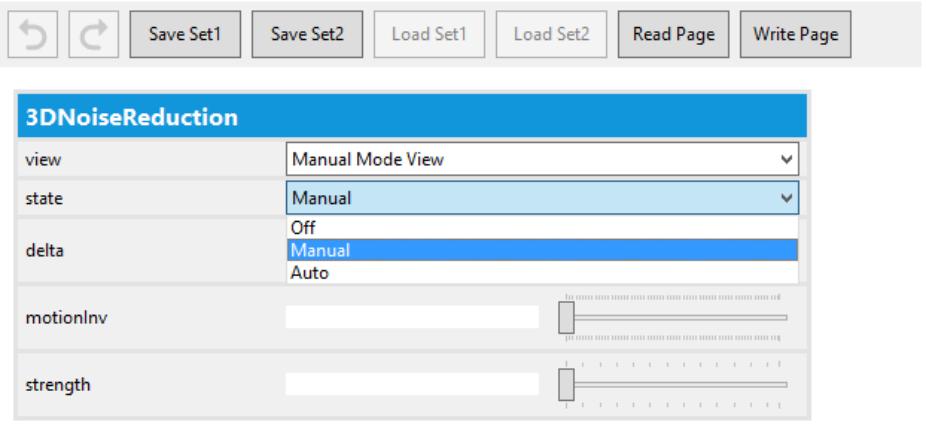
Figure 3.2‑14 Example of Option state
Numeric Matrix Parameters
Each numeric matrix parameter provides a “View” button. Clicking it opens a table window for editing the matrix, as shown in Figure 3.2‑15 and Figure 3.2‑16. Matrices with dimensions greater than two are represented in JSON format within the table.
The numeric matrix parameter window includes:
Parameter name, also used as the table name.
Value range for each cell.

Figure 3.2‑15 Matrix Parameter Example
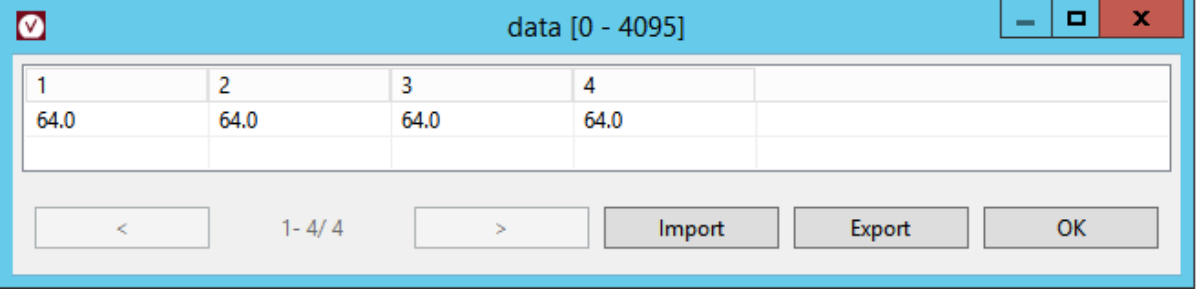
Figure 3.2‑16 Table for Editing a Matrix Parameter
In the table, the first row contains column headers. The buttons at the bottom are described in Table 3.2‑4.
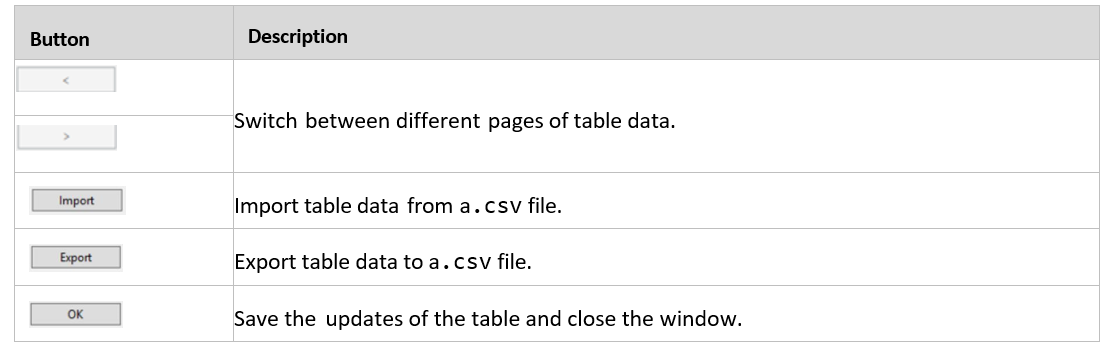
Table 3.2‑4 Buttons in a Table Window
ROI Matrix Parameters
Each ROI matrix parameter provides a “View” button. Clicking it opens a dialog for specifying Regions of Interest (ROI), as shown in Figure 3.2‑17 (the new tool loads YUV data into the client on the lower right).
To add an ROI, select a region in the image.
The ROI information, including coordinates, width, height, and weight, is automatically added to the table on the right.
To modify the weight of an ROI, double-click and edit the corresponding cell.
To delete a selected ROI, click the “Del” button in the corresponding row.
To save updates and exit, click “OK”.
Note: The preview dump import function is not yet supported. You can manually dump sample images and import them into the Select ROIs interface to assist in annotating ROI areas. Without importing, a pure white blank image will be displayed. This feature depends on sensor information settings described in Section 3.4.2.
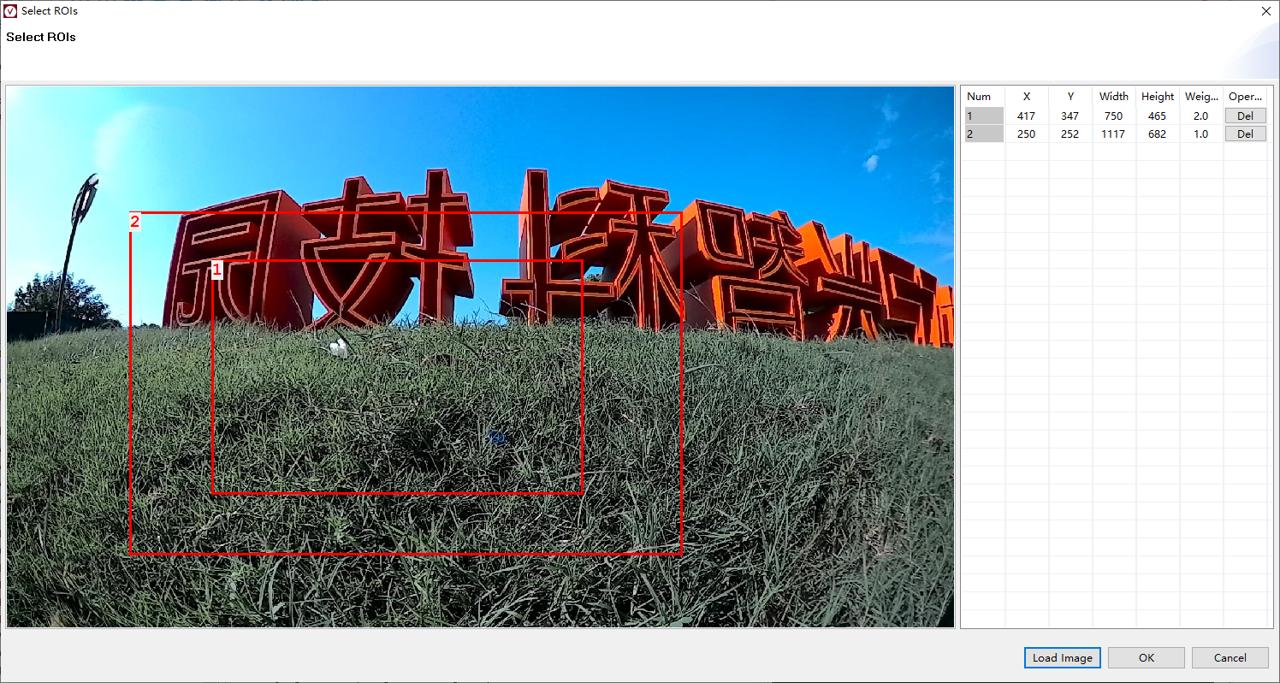
Figure 3.2‑17 Window for Editing an ROI Matrix Parameter
Color Matrix Parameters
Each color matrix parameter provides a “View” button. Clicking it opens a dialog to display statistics in a grayscale table, as shown in Figure 3.2‑18. The number in each cell represents the statistic, with 0 displayed as black and 255 as white.
For exposure statistics, the matrix size can be 25x25, 32x32, or others, depending on hardware statistics.
The dropdown list in the upper-left corner provides four options, each representing a channel. The color matrix displays statistics for the selected channel. Changing the channel updates the color matrix, which may take some time.
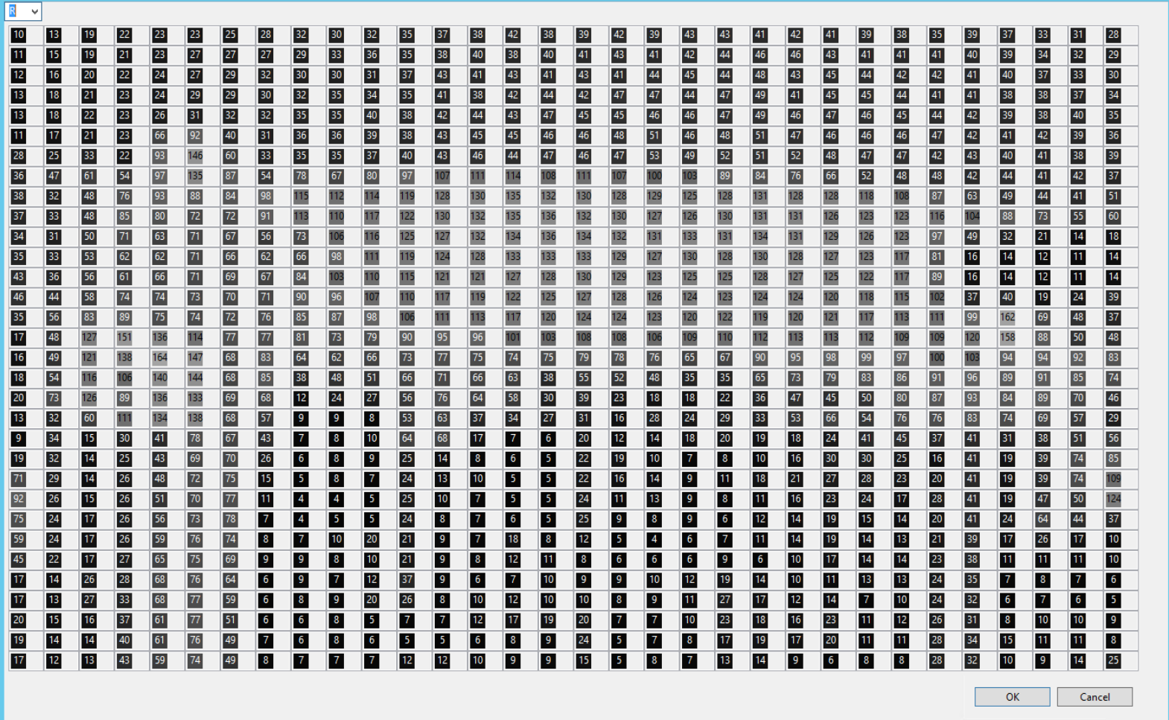
Figure 3.2‑18 Example of Color Matrix Window
Curve Parameters
Each curve parameter is configured using a line chart and a 2D matrix table, as shown in Figure 3.2‑19. Each row in the table specifies the coordinates of a control point on the chart. The matrix can be edited by dragging control points on the line chart or modifying coordinates in the matrix table. The number of control points is configurable, ranging from 3 to the actual number of points on the curve.
Note: Control points are used to configure the curve. Modifying the number of control points does not change the actual number of points on the curve. The line chart displays control points rather than actual points for easier configuration.
Each curve can be generated from an imported .csv file. The Y-values of the curve control points can be exported to a .csv file.
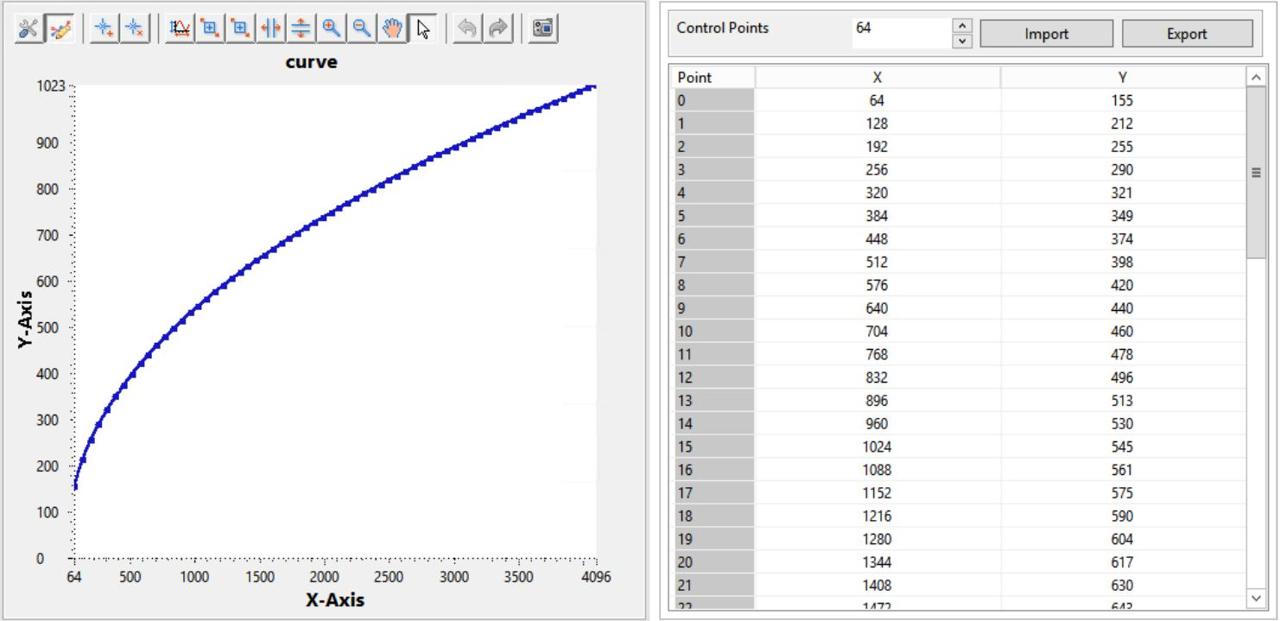
Figure 3.2‑19 Curve Parameter Example
For curve parameters in auto mode, a curve index option is provided above the table, as shown in Figure 3.2‑20. The curve index option controls the gain applied to the curve. You can select an index to switch between different gains and then further edit the matrix.
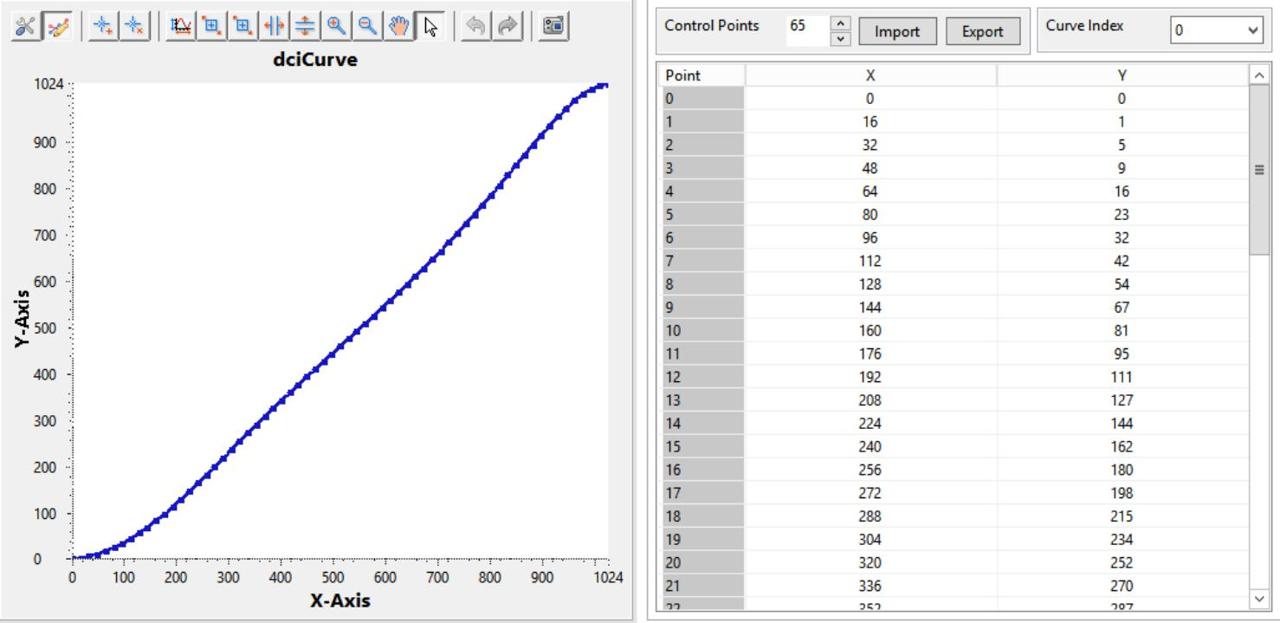
Figure 3.2‑20 Example of Curve Parameter in Auto Mode
Toolbar Above the Line Chart
A toolbar is located at the top of the chart. The buttons in the toolbar are described in Table 3.2‑5.
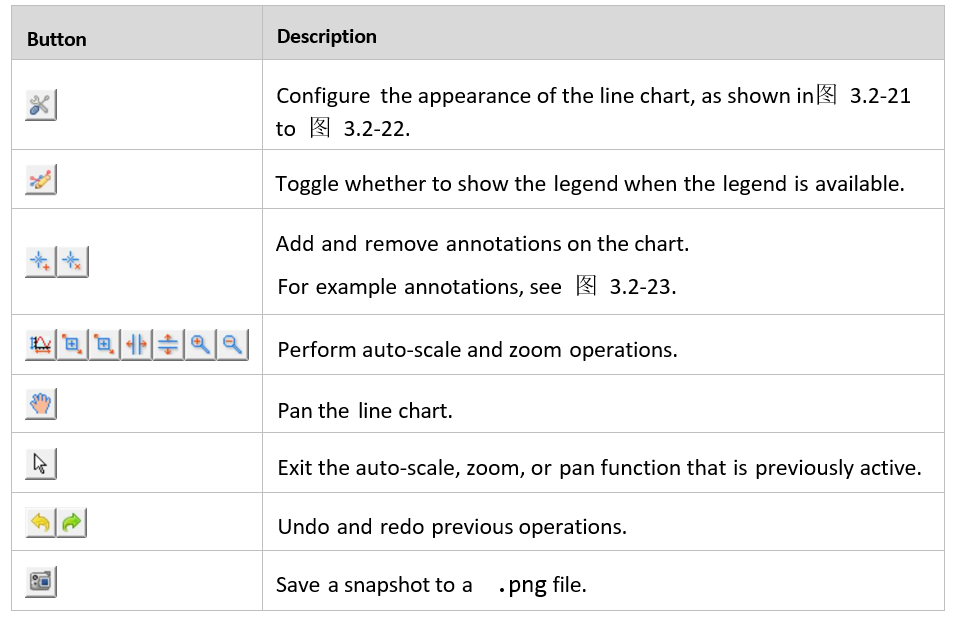
Table 3.2‑5 Toolbar Buttons Above a Line Chart
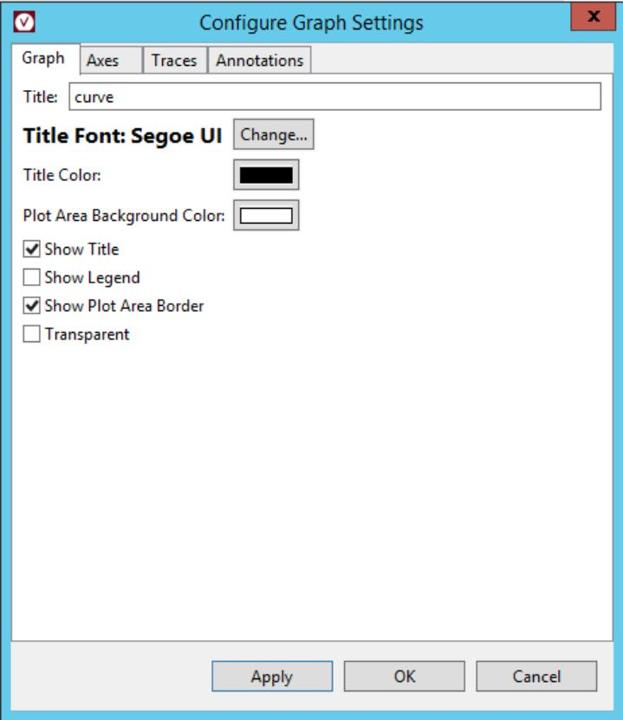
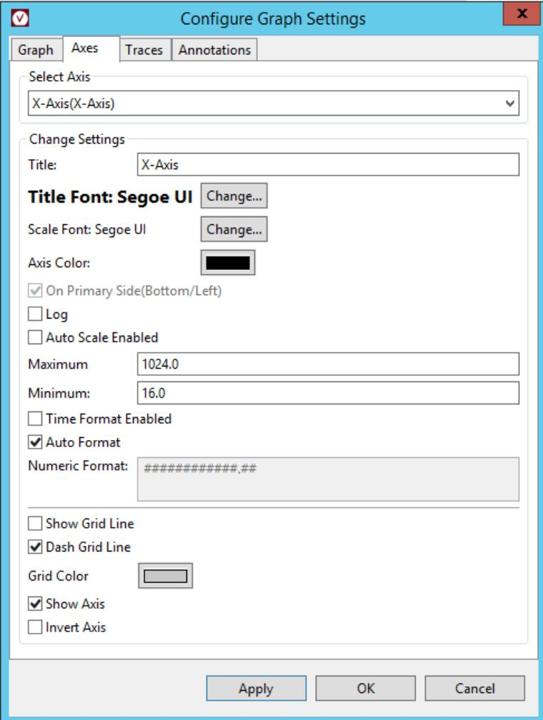
Figure 3.2‑21 Configure Graph Settings > Graph&Axes
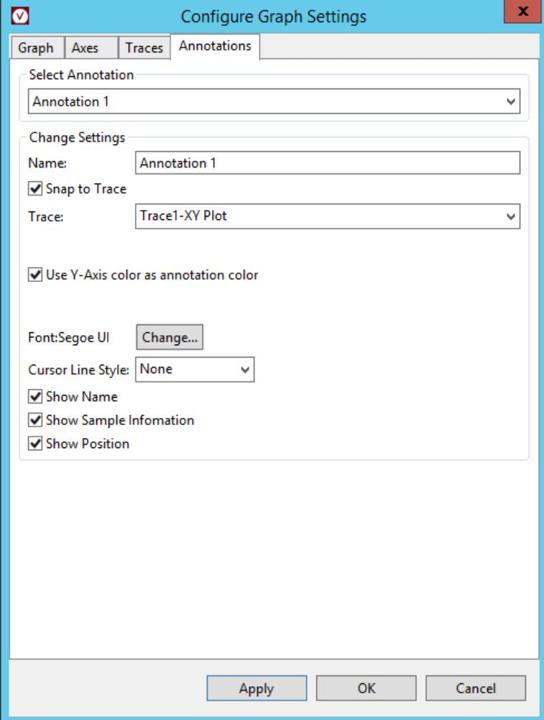
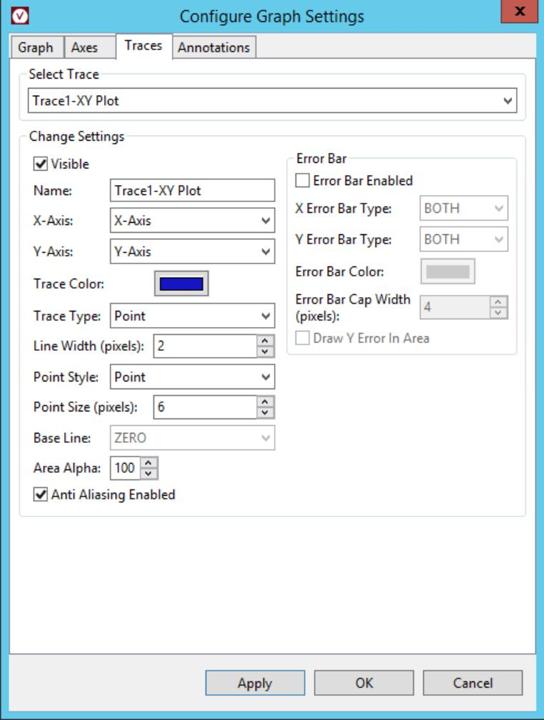
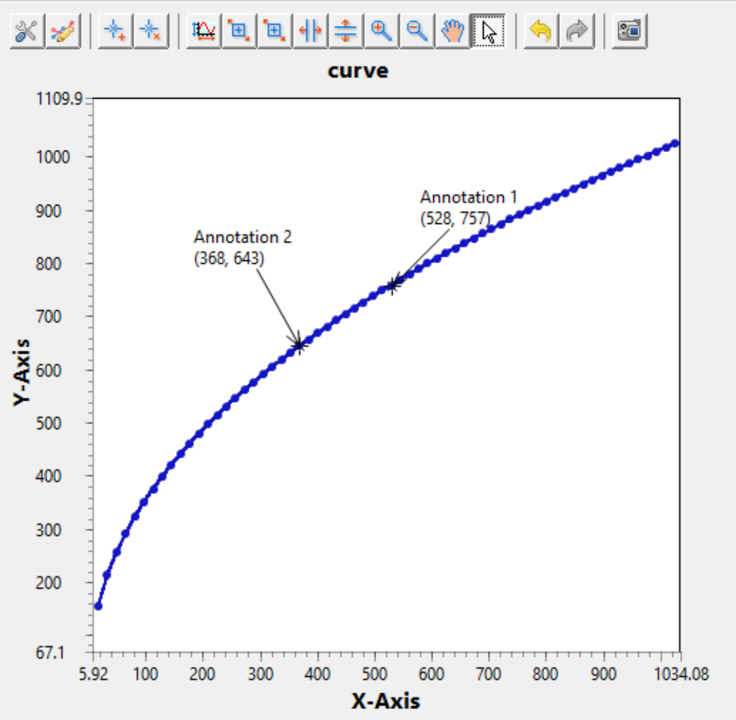
Figure 3.2‑22 Configure Graph Settings > Traces&Annotation
Figure 3.2‑23 Annotation Examples
File Parameters
Each file parameter provides a “Load File” button. Clicking it opens a dialog to load a .txt file generated by a calibration tool.
Note: If a .txt calibration file is loaded after starting the stream, the calibration data may not take effect. Therefore, it is recommended to import the .txt calibration file before starting the stream, after loading the .json calibration file. For information on how to load a .json calibration file, see Section 3.3.1.2.

Figure 3.2‑24 File Parameter Example
Console View
The Console view displays all interaction messages between VTunerClient and the Tuning Server, as well as runtime error and warning messages, as shown in Figure 3.2‑25.

Figure 3.2‑25 Console View Example
Tuning Solution
This section guides you on how to use VTunerClient to fine-tune the ISP running on development boards and emulators.
Generally, the workflow is as follows:
Import feature module settings into the ISP project.
(Optional) Inject raw images as input data into the Tuning Server.
Start the ISP pipeline by configuring the live preview function.
Tune ISP module parameters, or create batch jobs to tune multiple parameters or images at once.
Check tuning results from dumped and previewed images/videos.
Exporting and Importing Feature Module Settings
Export Debug Parameters from ISP Project
Prerequisites
• The VTunerClient workspace is displayed in the ISP Tuner view. For instructions, see Section 3.1.3.
• An ISP project is selected in the Project Explorer. For information on creating an ISP project, see Create ISP Project.
• VTunerClient is connected to the Tuning Server. For instructions, see Section 3.1.5.
• The ISP data stream has been started. For instructions, see Section 3.3.3.
Procedure
In the toolbar, click
 .
.In the pop-up Save dialog, select the target directory, name the file, and click “Save”.
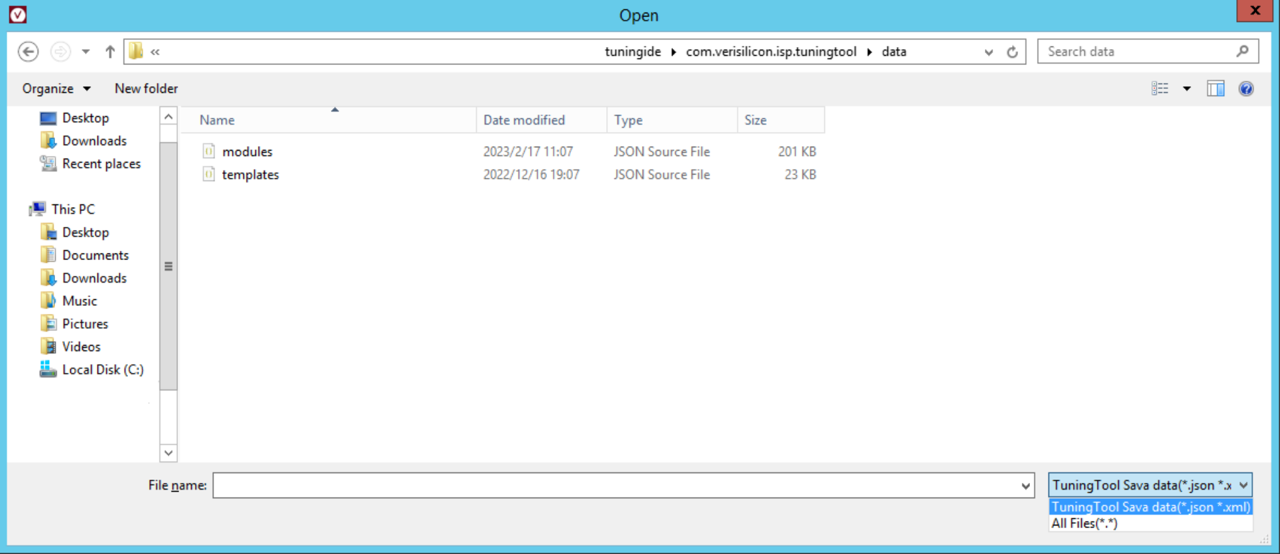
Figure 3.3‑1 Specifying the Location and Name of an Exported File
The Export dialog appears during the export process. A message indicating whether the export was successful will then be displayed in the dialog.
Figure 3.3‑2 Export Dialog
Outcome
A .json file containing module debug settings and calibration settings is created in the specified directory.
Next Steps
You can follow the instructions in Section 3.3.1.2 to import the exported file parameters into the ISP project.
Import Debug Parameters into ISP Project
This section imports feature module settings or calibration settings from a .json file into the Tuning Server.
Prerequisites
• The VTunerClient workspace is displayed in the ISP Tuning view. For instructions, see Section 3.1.3.
• The default .json tuning file from the SDK and the .json calibration file generated by the calibration tool are available for import. Alternatively, files exported and edited as needed according to Section 3.3.1.1 can be used.
• An ISP project is selected in the Project Resource Browser view. For information on creating an ISP project, see Create ISP Project.
• VTunerClient is connected to the Tuning Server. For instructions, see Set Up Connection Service.
Procedure
In the toolbar, click
 .
.In the pop-up Open window, select the .json file to import, then click “OK”.
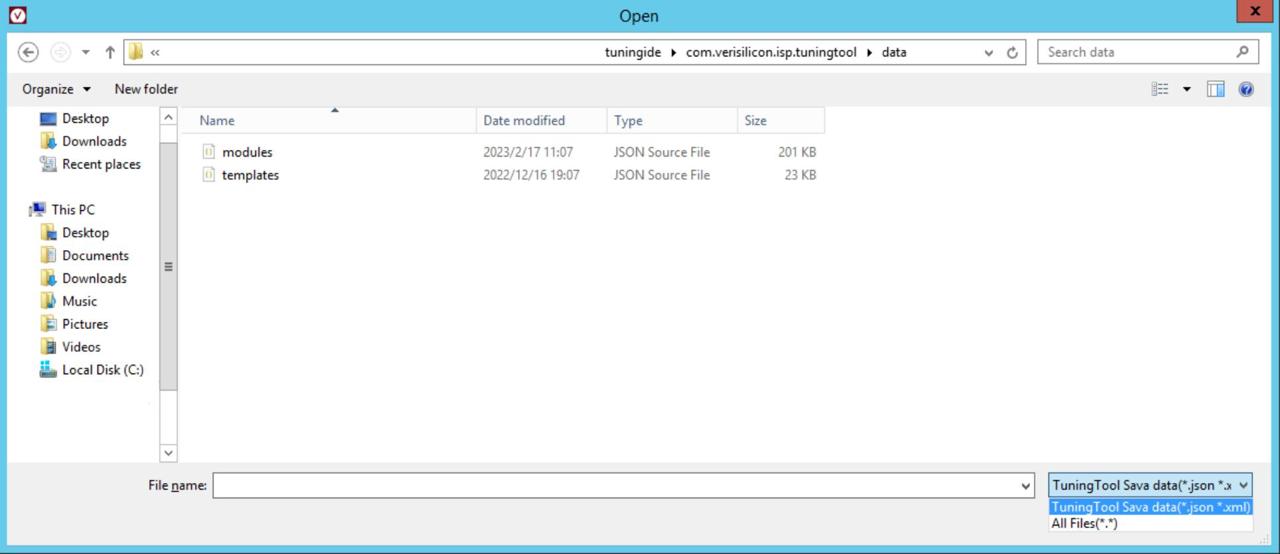
Figure 3.3‑3 Selecting a JSON File
The import process displays an import dialog. A message indicating whether the import was successful will then be shown in the dialog.
Figure 3.3‑4 Import Dialog
Result
• The current ISP project is updated with the feature module settings from the imported file.
• The feature module settings from the imported file are synchronized to the Tuning Server. The VTunerClient workspace then updates to reflect the settings used on the Tuning Server side.
Inject Raw Images into Tuning Server
This section sends local raw image or video data to the Tuning Server for ISP processing.
Note: This feature is only supported under TCP connection; if using sensor input, this section does not apply.
• The VTunerClient workspace is displayed in the ISP Tuner view. For instructions, see Section 3.1.3.
• An ISP project is selected in the Project Explorer view. For information on creating an ISP project, see Create ISP Project.
• VTunerClient is connected to the Tuning Server. For instructions, see Section 3.1.5.
Procedure
In the toolbar, click
 .
.
In the pop-up Image Input dialog, specify the following information:
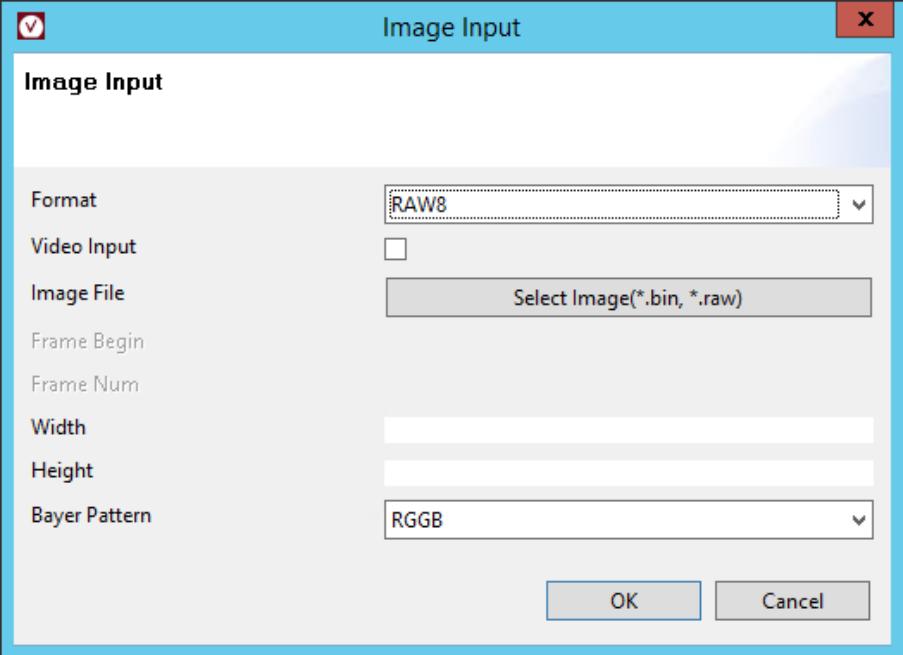
Figure 3.3‑5 Image Input Dialog When a Normal Raw Format Is Selected
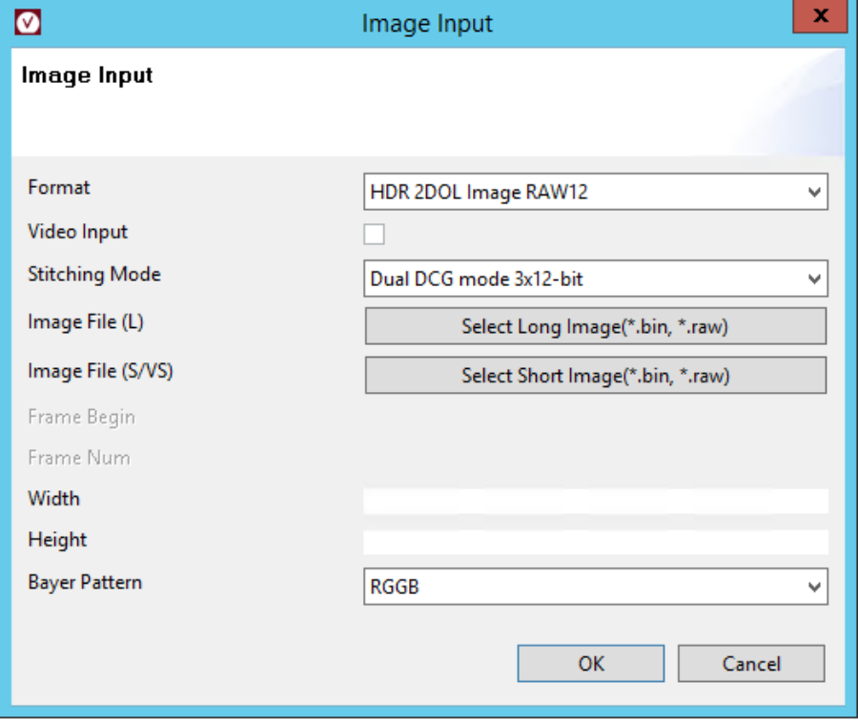
Figure 3.3‑6 Image Input Dialog When an HDR Raw Format Is Selected
From the “Format” dropdown list, select either “Normal Raw” or “HDR” format.
Click “Video Input” and select a raw image or video file.
If the checkbox is selected, video input is required.
If the checkbox is cleared, image input is required.
If “Normal Raw” format is selected from the Format dropdown list, click the “Image File” button to the right of “Select Image”, and select an image or video based on the “Video Input” setting.
If “HDR” format is selected from the Format dropdown list, configure the HDR mode as follows:
From the Stitching Mode dropdown list, select the stitching mode before composition.
To the right of each image file parameter, click the “Select Image” button, and select an image or video based on the “Video Input” setting.
If the “Video Input” checkbox is selected, perform the following steps:
Enter the ID of the starting frame in the “Frame Begin” text box.
Enter the number of frames in the “Frame Num” text box.
Enter the input width and height in the “Width” and “Height” text boxes, respectively.
From the Bayer Pattern dropdown list, select the input Bayer pattern.
Click “OK”.
Outcome
The Tuning Server processes the sent image or video data.
Configure Live Preview
This section starts the live preview function to view the ISP output in real time during tuning.
Prerequisites
The VTunerClient workspace is displayed in the ISP Tuning view. For instructions, see Section 3.1.3.
An ISP project is selected in the Project Explorer view. For information on creating an ISP project, see Create ISP Project.
VTunerClient is connected to the Tuning Server. For instructions, see Set Up Connection Service.
(Optional) If the server requires raw data input, send raw data to the Tuning Server. For instructions, see Section 3.3.2, Inject Raw Images into Tuning Server.
Customize sensor information. For instructions, see Section 3.4.2, Customize Sensor Information.
Procedure
In the toolbar, click
 .
.
In the pop-up Live Preview dialog, specify the following information:
Note: Currently, only the “Input Type” and “Sensor Name” fields need to be configured; other fields can be ignored (the preview function uses a third-party tool Hbplayer instead, which will be introduced later). Also, regardless of whether real-time preview is needed, these two checkboxes are required for functional adjustments.
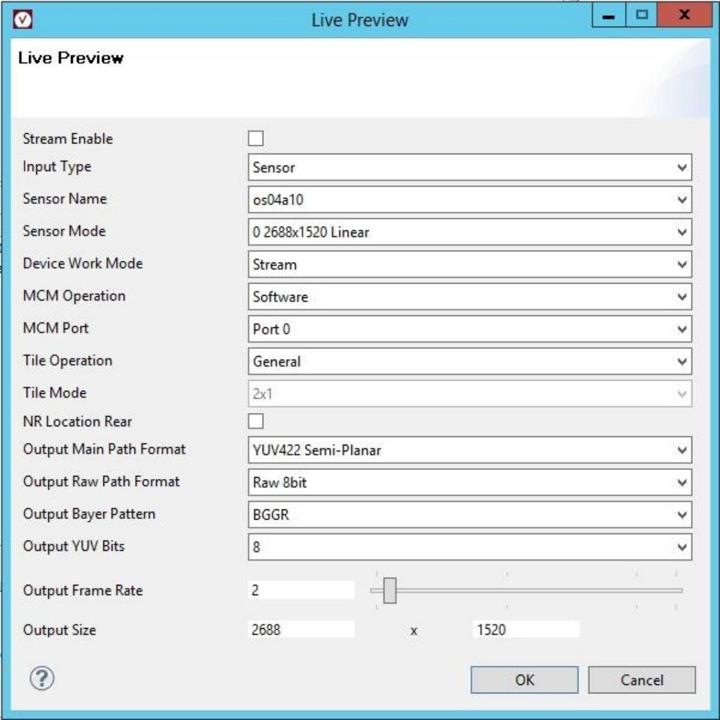
Figure 3.3‑7 Configuring Live Video Preview
From the “Input Type” dropdown list, select the type to input to the Tuning Server.
If RDMA is selected, the ISP uses linear raw data as input. Then, “Sensor Name” and “Sensor Mode” become non-editable.
If Retiming is selected, the ISP uses HDR image data as input. Then, “Stitch HDR” must be selected from the “Sensor Mode” dropdown list.
If “Sensor” is selected, the ISP uses sensor input information.
From the “Sensor Name” dropdown list, select the sensor that matches the setup. For instructions, see Section 3.4.2, Customize Sensor Information.
Hbplayer Online Preview ToolTool Acquisition
Can be obtained via SDK package or by interfacing with D-Robotics’ technical interface.
Prerequisites
The board must be outputting data stream normally.
Hbplayer has been launched and is running properly on the working PC (click hbplayer.bat under the hbplayer\out directory).
Operation Steps
Click the menu bar in Hbplayer
 .
.Set the board’s IP address (if RAW images are to be displayed, set the corresponding format below)
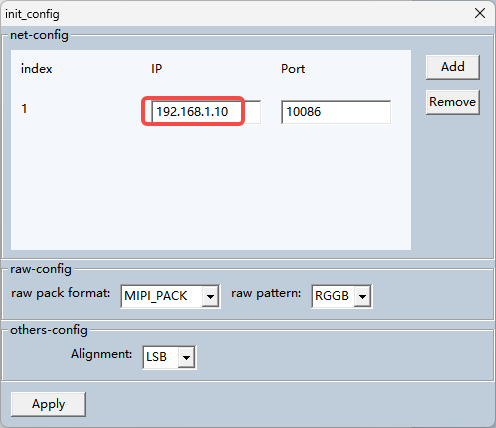
Figure 3.3‑8 Hbplayer Connection
On the main page, select J6 in Version Select.
Click connect under network on the main page to view the real-time drawing, as shown in Figure 3.3‑9.
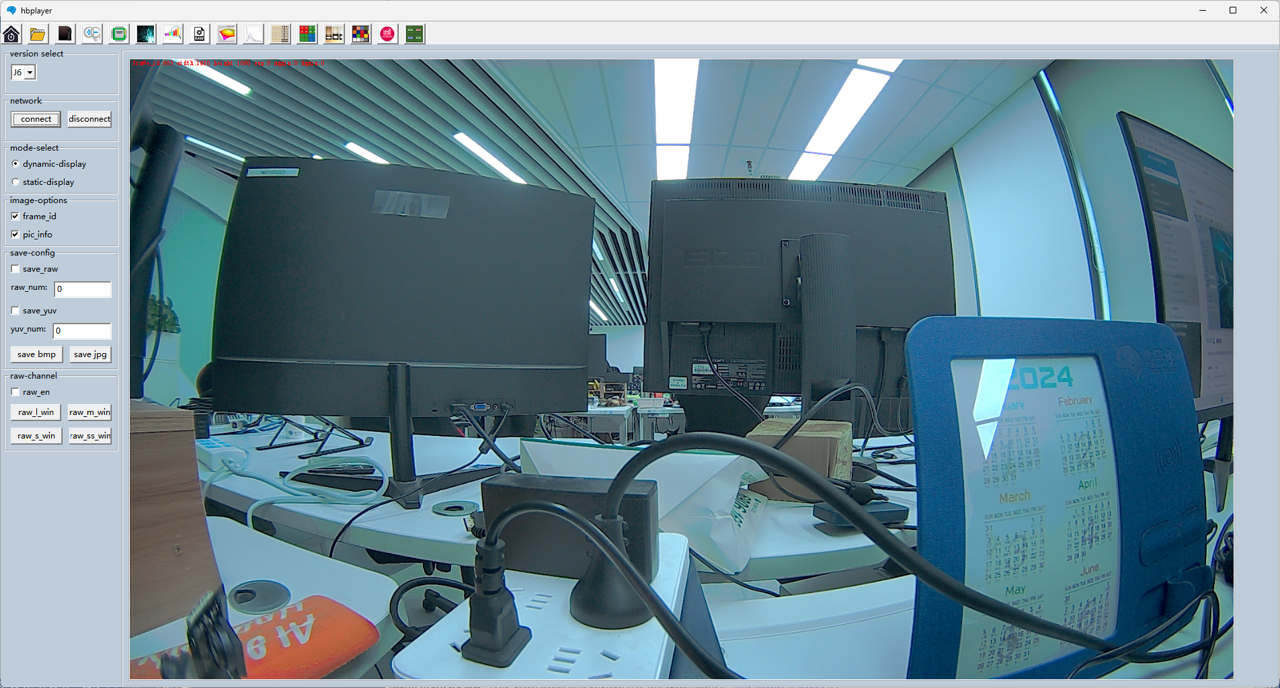
Figure 3.3‑9 Hbplayer view
Note: Hbplayer receives YUV data sent from the board via network and performs software decoding for real-time display; high-resolution images may suffer frame drops due to bandwidth limitations.
Feature Module Debugging
This section mainly describes how to debug parameters of ISP’s Feature Module.
Prerequisites
The VTunerClient workstation displays the ISP Tuning view. For instructions, refer to Section 3.1.3.
An ISP project has been selected in the Project Resource Browser view. For information on creating an ISP project, refer to Create ISP Project.
VTunerClient is connected to the Tuning Server. For instructions, refer to Set Connection Service.
The ISP pipeline has been started and initialized. For details, refer to Configure Real-Time Preview.
Configuration Steps
In the Features preview, select the feature module you wish to adjust.
The corresponding parameters of the module will then be displayed in the Details view.
In the Details view, configure the module according to the description in Parameter Types.
By default, when switching to another module, VTunerClient automatically reads data from the Tuning Server. After re-establishing the connection, you need to click “Read Page” in the control bar to manually synchronize data. Additionally, after importing a .json file, the current view will automatically update to reflect data read from the server.
Click “Write Page” to write the current parameter settings to the Tuning Server.
If the “Automatically write data when modify parameter” checkbox in Preferences is selected, this step can be skipped. For more information, refer to Section 3.3.7, Configure Preferences.
Operation Result
The output video or image from the ISP is updated according to the adjusted module parameters.
Edit Registers
This section describes how to configure ISP registers.
Prerequisites
The VTunerClient workstation displays the ISP Tuner view. For instructions, refer to Section 3.1.3.
An ISP project has been selected in the Project Explorer view. For information on creating an ISP project, refer to Create ISP Project.
VTunerClient is connected to the Tuning Server. For instructions, refer to Section 3.1.5.
The ISP pipeline has been started and initialized. For details, refer to Configure Real-Time Preview.
Operation Steps
In the toolbar, click
 .
.
The Edit Register page for registers will then appear.
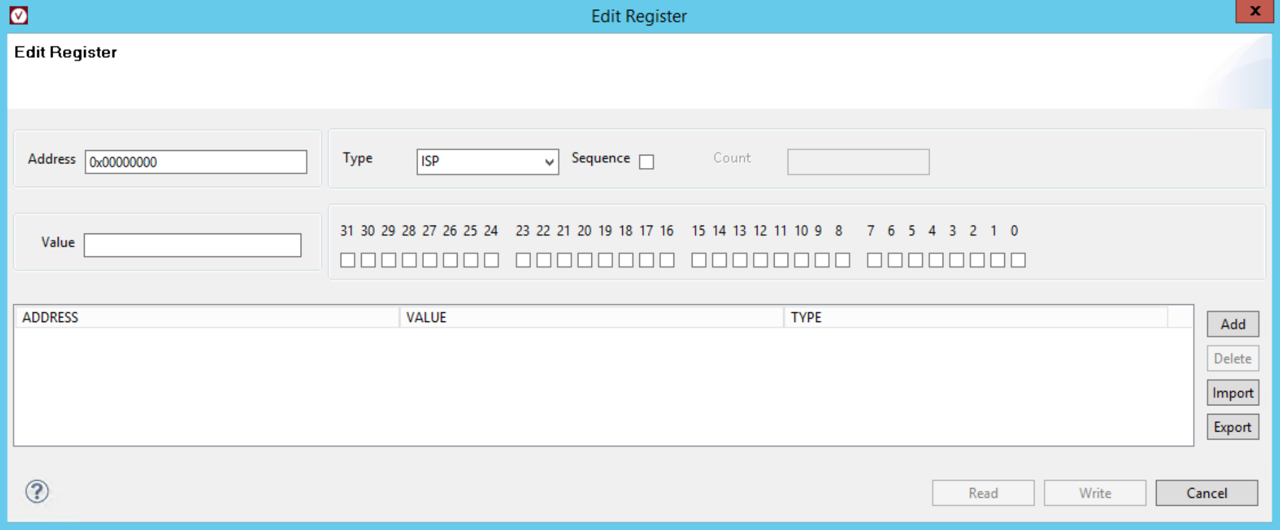
Figure 3.3‑10 Edit Register
● Important: Settings must strictly follow the requirements listed in the Software Accessible Register Document provided in the hardware release package.
In the “Address” text box, enter the address of the target register to be edited.
From the “Type” dropdown list, select whether to edit ISP registers or sensor registers.
If editing consecutive registers, select the “Sequence” checkbox.
If the “Sequence” checkbox is selected, enter the number of consecutive registers to be edited starting from the specified address.
In the “Value” text box, enter the new value for the register, or select/clear the corresponding checkboxes for each register bit on the right.
Click “Add” to add the register setting to the table. Adding fails if the address is unspecified or already exists in the table.
Alternatively, click Export to export the table to a .csv file, edit it, and then click “Import” to import it.
(Optional) In the table, select a record and click “Delete” to remove it from the table.
(Optional) Repeat steps 2 to 8 to edit the table to include all required register settings.
Click “Write” to update the Tuning Server with all register settings in the table. To query the values of registers in the table, click “Read”. The query results will overwrite the “VALUE” column in the table.
Operation Result
ISP register settings are updated according to the input values.
Dump Image or Video
This section describes how to dump images or video from ISP.
Prerequisites
The Hbplayer tool is already displaying images. For details, refer to Section 3.1.3.
An ISP project has been selected in the Project Explorer view. For information on creating an ISP project, refer to Create ISP Project.
VTunerClient is connected to the Tuning Server. For instructions, refer to Set Connection Service.
The ISP pipeline has been started and initialized. For details, refer to Configure Real-Time Preview.
Operation Steps
Open the Hbplayer preview interface.
Click the area in Figure 3.3‑11 to dump YUV/BMP/JPG data.
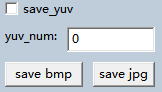
Figure 3.3‑11 Hbplayer dump image
After dumping is complete, the captured data will be located in the /dump folder under the Hbplayer root directory.
Configure Preferences
This section describes how to configure VTunerClient preferences.
Prerequisites
Ensure that the VTunerClient workstation is connected to the service and the board.
Operation Steps
In the toolbar, click
 .
.
The following page will appear.
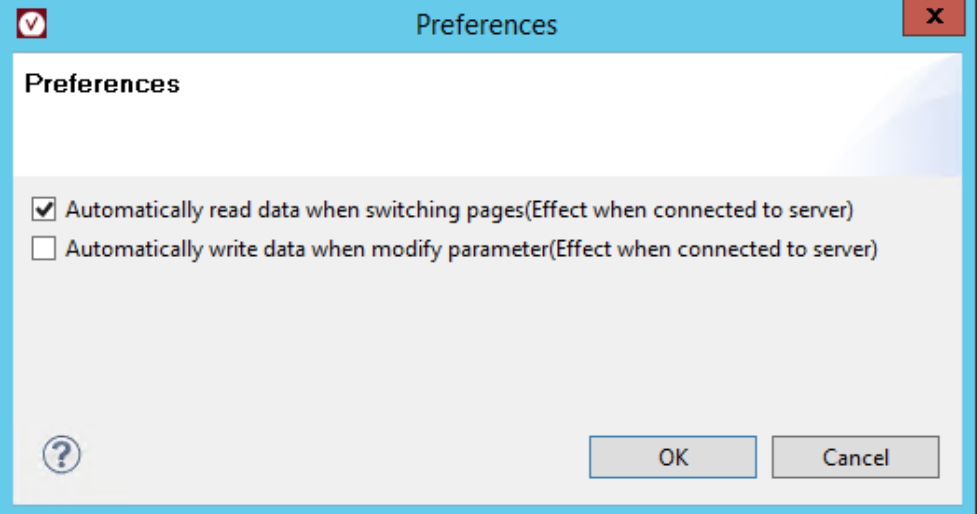
Figure 3.3‑12 Configuring Preferences
Select or clear “Automatically read data when switching pages” to control whether data is automatically read from the Tuning Server when switching pages and used to update parameter information.
Select or clear “Automatically write data when modify parameter” to control whether data is automatically written to the Tuning Server when adjusting parameter modules.
Click “OK”.
Batch Tuning
VTunerClient provides a batch tuning feature to allow multiple parameters or images to be adjusted in bulk. Two batch modes are available:
Single Image Mode
In this mode, multiple parameters can be adjusted on a single input image. All candidate values for each selected parameter are arranged and combined. A tuning task is created to apply each parameter value combination to the input image. The tuning tasks created in the batch form a batch job.
Multi-Image Mode
In this mode, fixed parameter values can be applied to multiple images, and output images obtained in bulk. A tuning task is created for each image. The tuning tasks created in the batch form a batch job.
Images generated by each tuning task are treated as tuning results and saved to a specified path. After each batch job is completed, you can view and compare the results in VTunerClient.
All batch jobs are archived in a database named isp_tuningtool.db located in the workspace. You can view and manage archived jobs in VTunerClient.
Creating a Batch Job in Single-Image Mode
This section describes creating a batch job in single-image mode to adjust multiple parameters in bulk. In single-image mode, you can tune images imported from the local system or video dumped from the sensor.
Prerequisites
VTunerClient is connected to the Tuning Server.
For instructions, refer to Section 3.1.5, Set Connection Service.
Image/Video Dump function is working properly.
For instructions, refer to Section 3.3.6, Dump Image or Video.
If you want to tune images imported from the local system, the image input function is working and streaming has been started.
For instructions, refer to Section 3.3.2, Inject Raw Images into Tuning Server.
Operation Procedure
On the toolbar, click
 .
.
The batch job dialog appears.
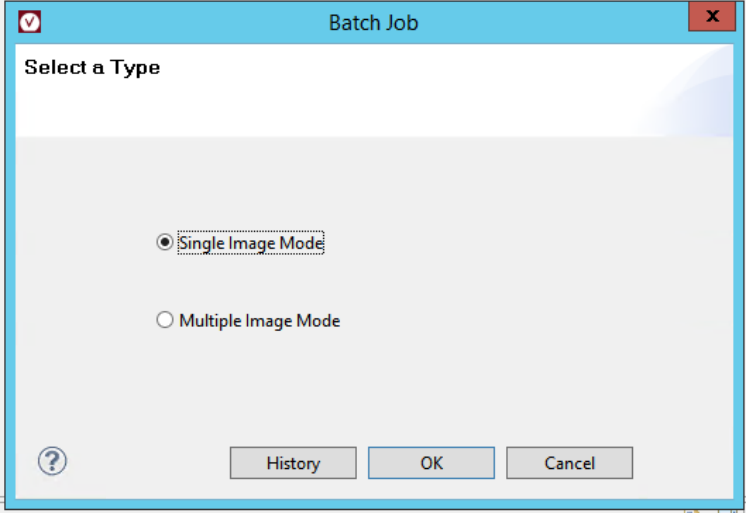
Figure 3.3‑13 Selecting a Mode for a Batch Job
Select Single Image Mode and click OK.
A wizard page appears to guide you through creating a batch job.
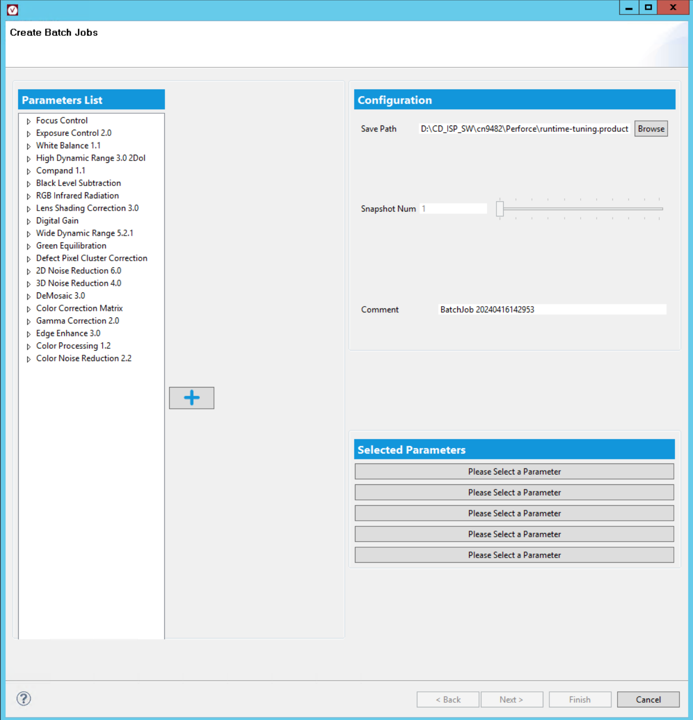
Figure 3.3‑14 Creating a Batch Job in Single-Image Mode
In the “Configurations” section, configure basic settings for the batch job and click Next.
To the right of “Save Path”, click “Browse” and select the directory where you want to save tuning results.
In the “Comment” text box, enter a comment for the batch job.
Note: Snapshot count indicates the number of images you want to capture for each tuning task and is fixed at 1 in single-image mode.
In the “Parameters List” section, select the parameters to adjust and click
 to add them to the “Selected Parameters” section.
Alternatively, double-click parameters to add them to the “Selected Parameters” section.
You must select at least one parameter. Up to five parameters can be selected.
Only root nodes in the “Parameters List” section can be added to the “Selected Parameters” section.
Note: All parameters prefixed with AUTO will not appear in the “Parameters List” section and are not applicable for batch tuning.
In the “Selected Parameters” section, adjust and verify the selected parameters for tuning the input image.
For each parameter section, Count indicates the number of candidate parameter values. Ensure the Count value is greater than or equal to 1.
Parameter sections vary depending on parameter type. For details, refer to Parameter Types for Batch Tuning.
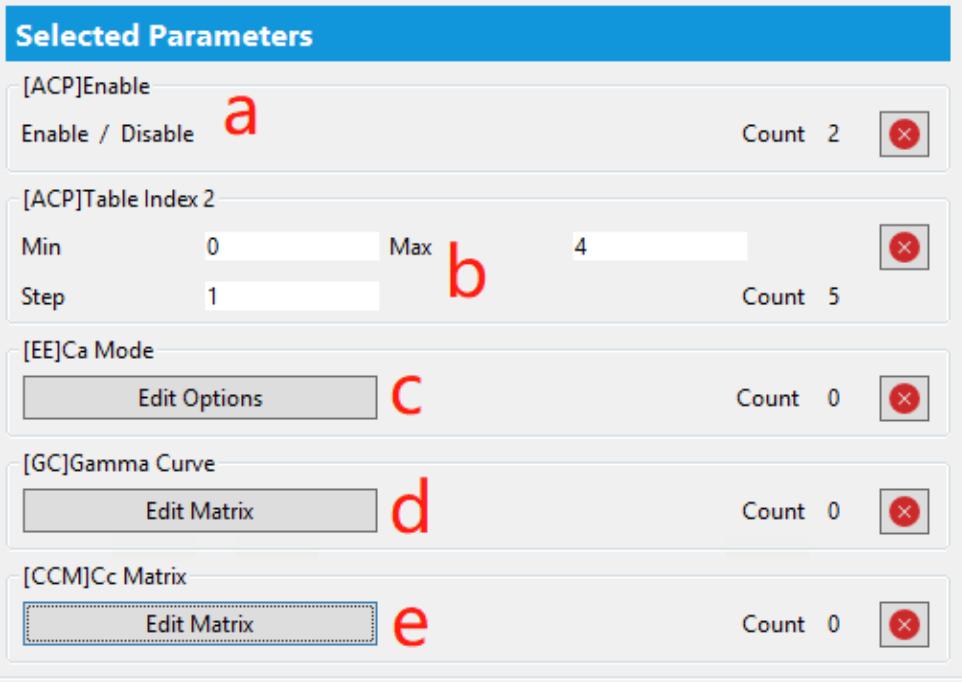
Figure 3.3‑15 Example of the Selected Parameters Section
Click the “Next” button to create the batch job.
A unique ID is then assigned to the batch job. Additionally, a progress bar appears showing the progress of job creation.
When tuning video dumped from a sensor, the preview video may change during processing. However, after the batch job completes, it will revert to its original state.
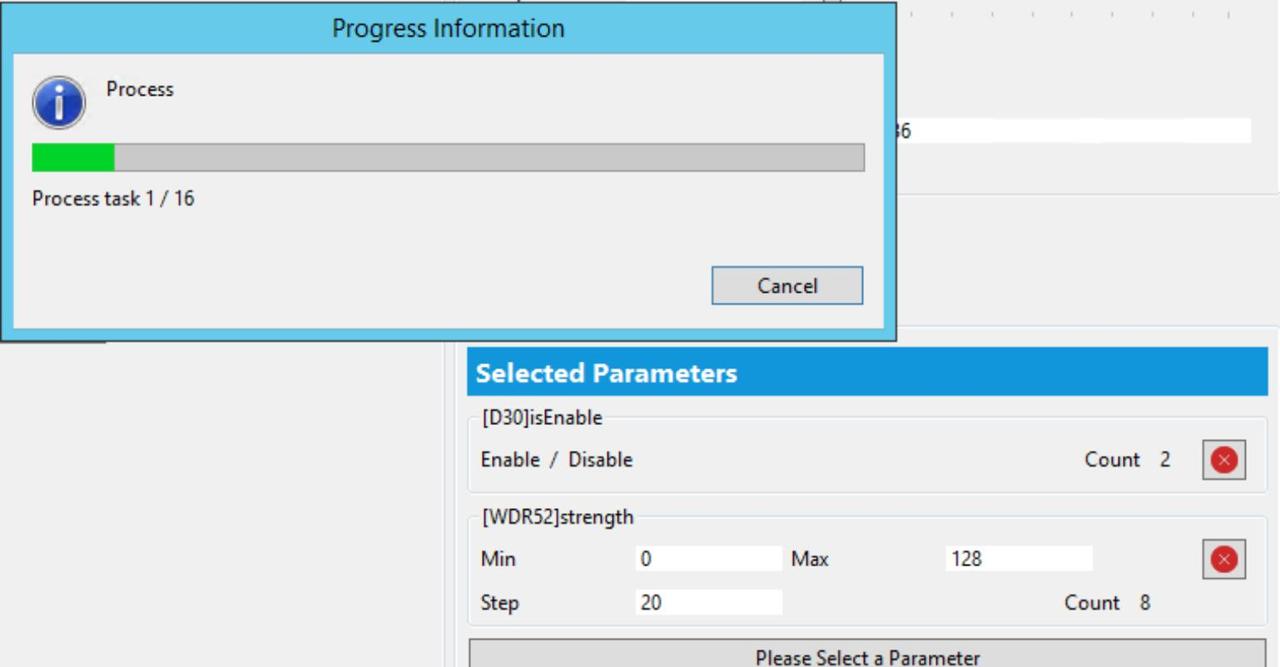
Figure 3.3‑16 Progress Bar for Creating a Batch Job
Wait for the batch job to complete.
Operation Result
A result display page appears showing result images for each tuning task in the batch job, as shown in Figure 3.3‑17.
Result images from the batch tuning are saved in .jpg format to the directory specified by “Save Path”.
All parameters adjusted in the batch job are restored to the values applied before the job ran. The preview image also reverts to its state prior to the batch job.
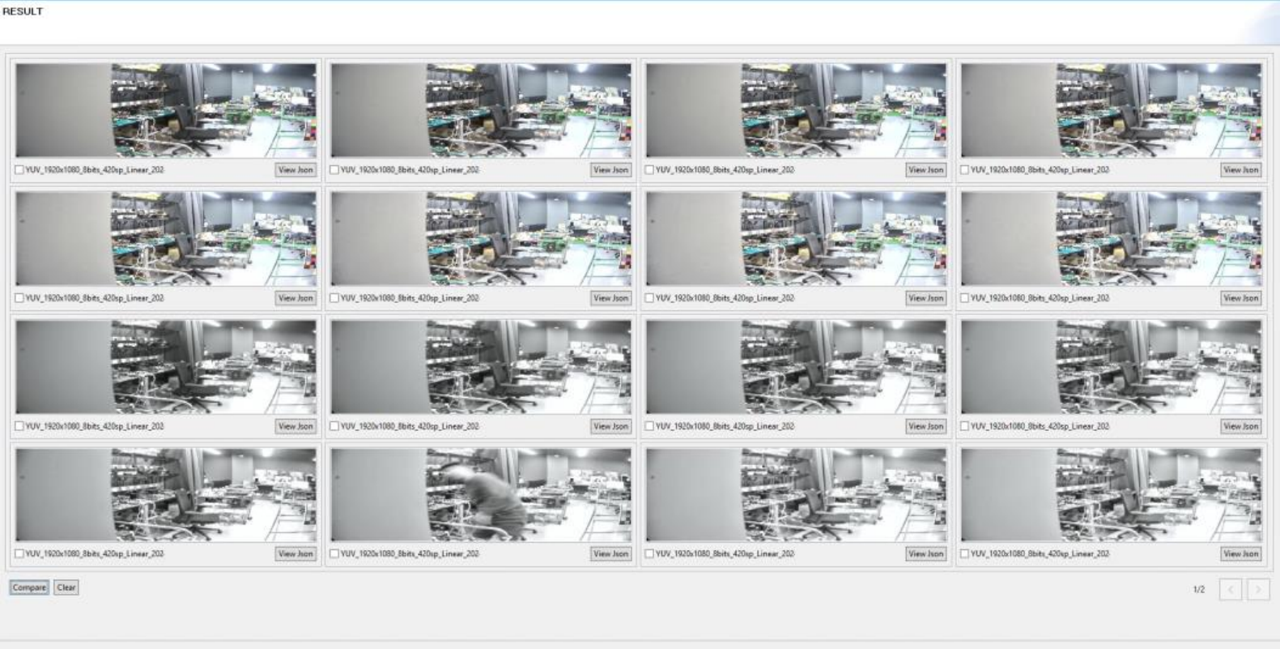
Figure 3.3‑17 Example of Batch Job Results
Follow-Up Actions
On the batch job results page:
To view detailed information of a result image, double-click the image.
To compare two result images, check the checkbox before the image names and click “Compare” at the lower-left corner.
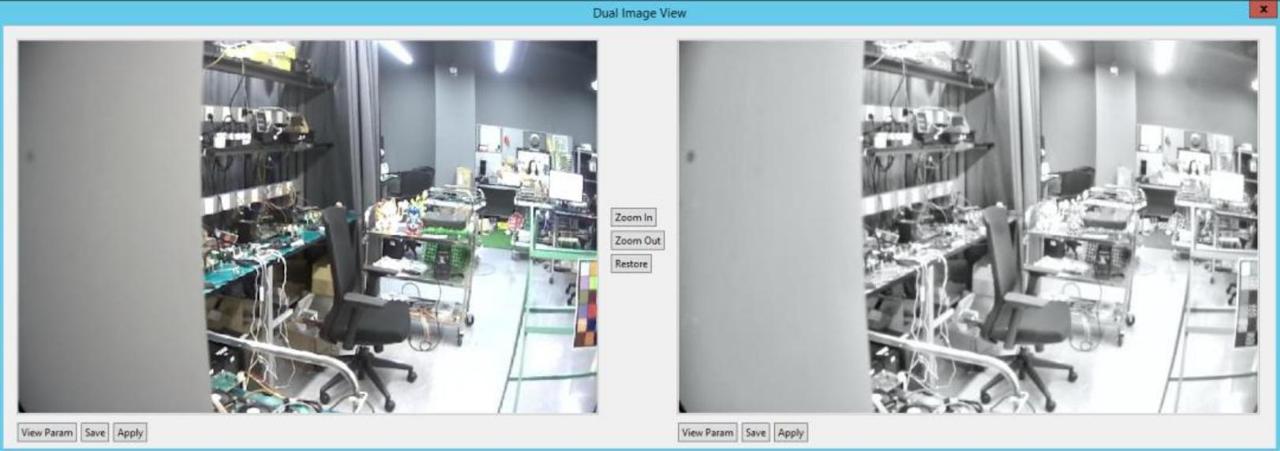
Figure 3.3‑18 Example of Dual Image View Dialog
You can click the “Clear” button to deselect all images.
To modify the configuration of the batch job, click “Back”.
Then, clicking the “Next” button will create a new job with a new ID.
To view the original and adjusted JSON configuration scripts for the selected parameters, click “View JSON”. In the pop-up JSON view dialog:
Base json refers to the JSON configuration script applied before running the batch job.
Diff json refers to the JSON configuration script applied during the batch job.
Other parameters are not included in these JSON configuration scripts. For information on the complete original JSON configuration script, refer to the BaseJson file in the workspace.
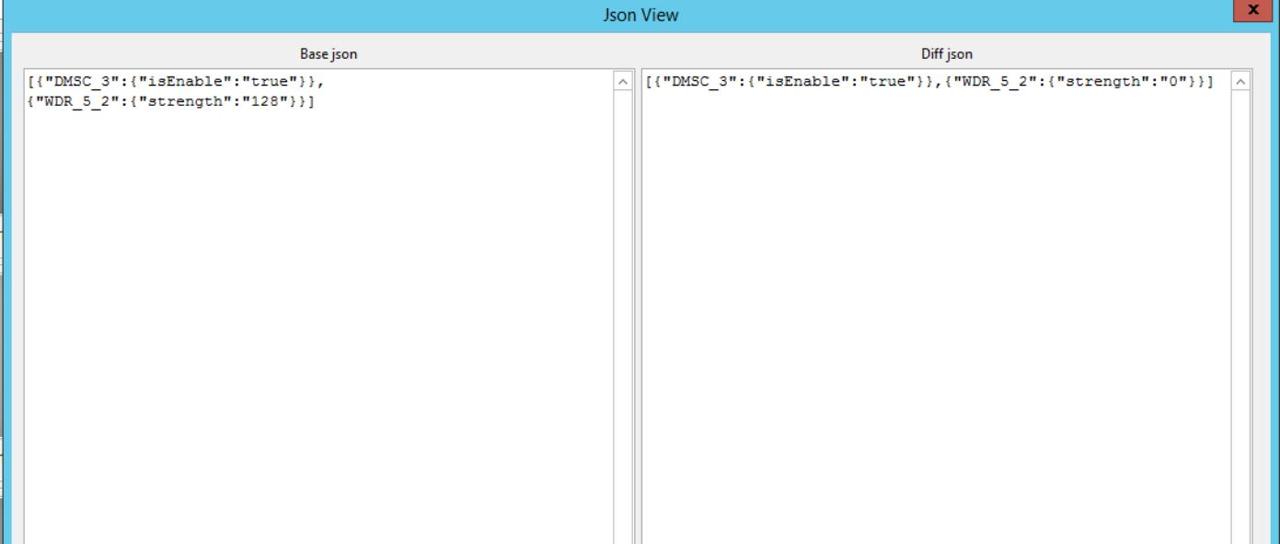
Figure 3.3‑19 Example of Json View
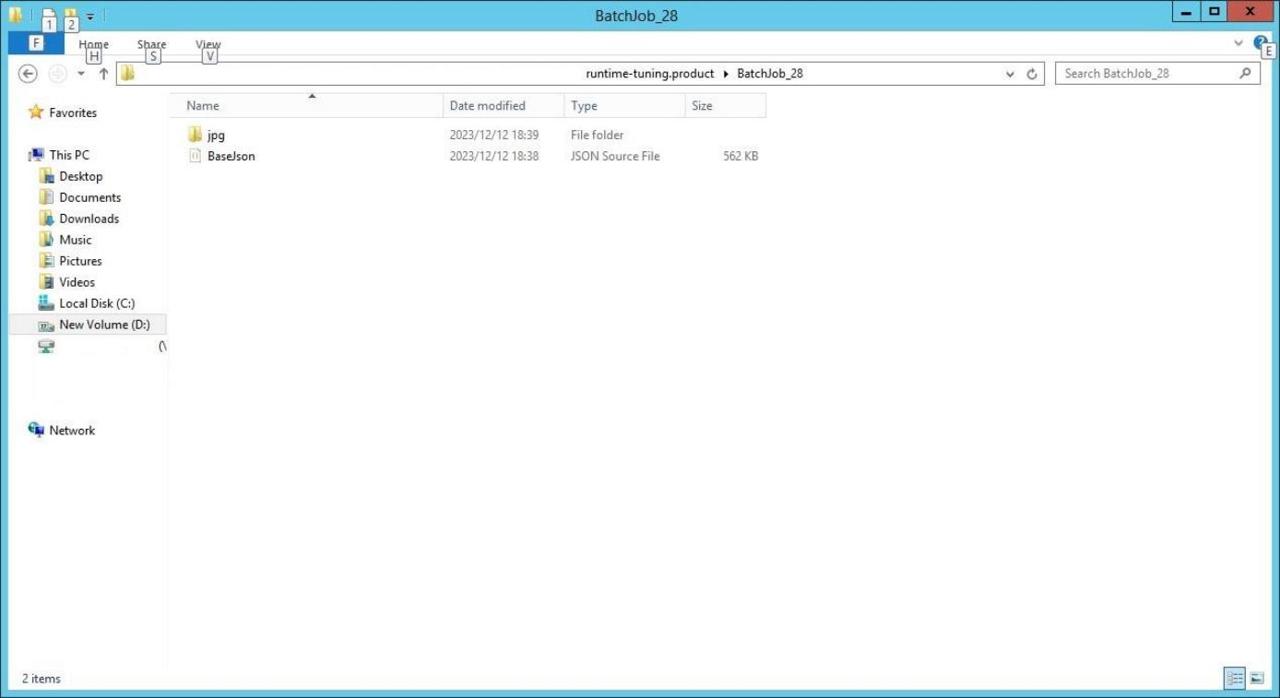
Figure 3.3‑20 Example of BaseJson File and Captured Images for a Batch Job
For information on managing historical batch jobs, refer to Section 3.3.8.3, Managing Archived Batch Jobs.
Parameter Types for Batch Tuning
In batch tuning under single-image mode, available configurations for each parameter vary by type. For example sections of each parameter type, see Figure 3.3‑15.
The following parameter types are available for batch tuning:
Boolean Parameters (a in Figure 3.3‑15)
Candidate values for boolean parameters are fixed as true and false.
Integer or Floating-Point Parameters (b in Figure 3.3‑15)
For integer or floating-point parameters, you can specify minimum value, maximum value, and step size, which together define the candidate value list. Both minimum and maximum values are included in the candidate list.
Option Parameters (c in Figure 3.3‑15)
Click the “Edit Options” button to edit option parameters. All selected items are treated as candidate values. At least one option must be selected for each option-type parameter.
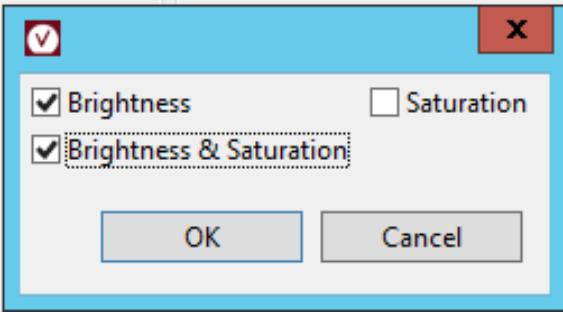
Figure 3.3‑21 Example of Editing an Options Parameter
Matrix and Curve Parameters (d and e in Figure 3.3‑15)
Curves are treated as the same parameter type as matrices. The difference is that matrix parameter values are one-dimensional, while curve parameter values are two-dimensional.
Click the “Edit Matrix” button to edit matrix or curve parameters.
To add a matrix value, click the green icon in the upper-right corner. The matrix value is named “Unnamed Matrix” by default.
Note: After clicking the green icon, a read request to add the matrix value is sent to the Tuning Server. If the read operation fails, clicking the green icon may have no effect.
To edit a matrix value, click its name.
To remove a matrix value, click the red icon to the right of the matrix value name.
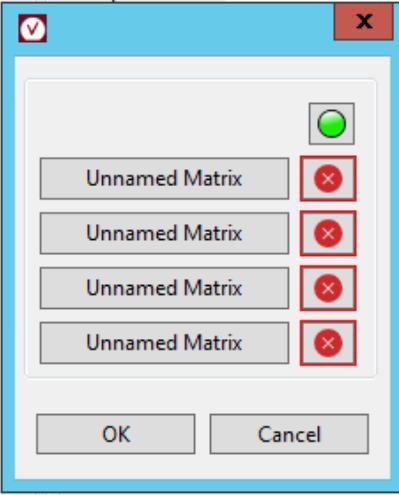
Figure 3.3‑22 Example of Editing a Matrix Parameter
Creating a Batch Job in Multi-Image Mode
This task creates a batch job in multi-image mode to obtain tuning results for multiple images with the same parameter settings in bulk. In multi-image mode, you can only tune images imported from the local system.
Prerequisites
VTunerClient is connected to the Tuning Server.
For instructions, refer to Section 3.1.5, Setting Connection to Tuning Server.
Image/Video Dump function is working properly.
For instructions, refer to Section 3.3.6, Dump Image or Video.
Image input function works properly and can start streaming.
However, do not input images or start streaming in advance. For instructions, refer to Section 3.3.2, Inject Raw Images into Tuning Server.
Operation Procedure
On the toolbar, click
 .
.
The batch job dialog appears.
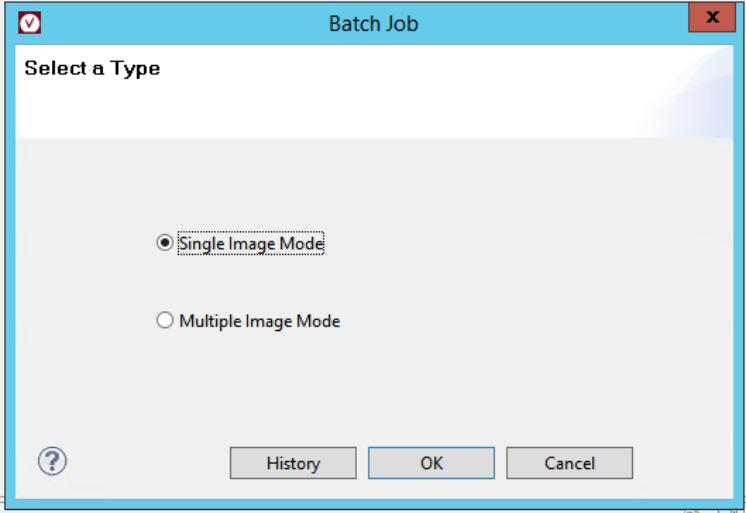
Figure 3.3‑23 Selecting a Mode for a Batch Job
Select Multi-Image Mode and click OK.
A dialog appears to guide you in creating a batch job.
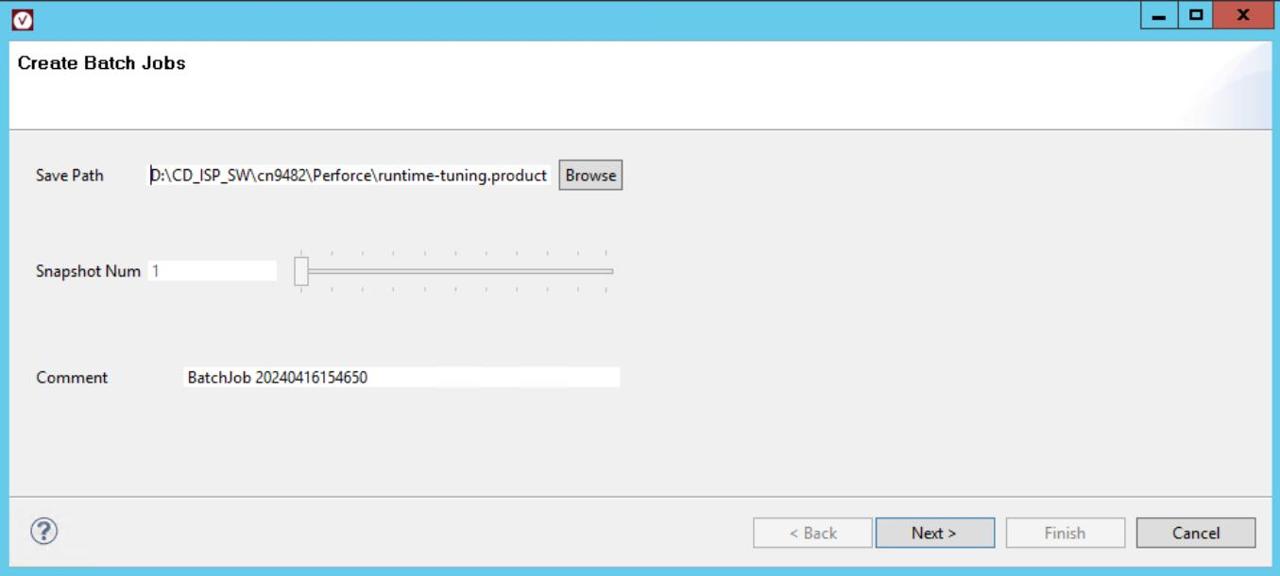
Figure 3.3‑24 Configuring Image Capture for a Multi-Image Batch Job
In the Create Batch Jobs step, specify basic information for the batch job as follows and click Next.
To the right of “Save Path”, click “Browse” and select the directory where you want to save tuning results.
In the “Comment” text box, enter a comment for the batch job.
Note: Snapshot Num indicates the number of images you want to dump for each tuning task and is fixed at 1 in single-image mode.
In the Multiple Images Input step, specify input image information and click Next.
For information on parameters in this step, refer to Section 3.3.2, Inject Raw Images into Tuning Server.
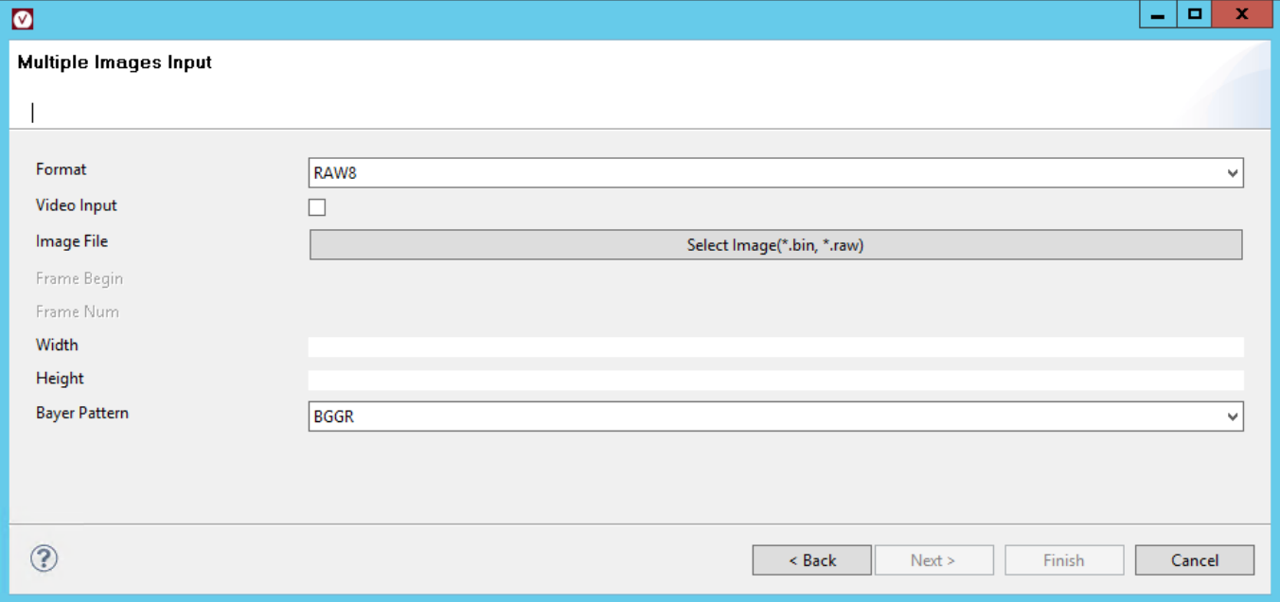
Figure 3.3‑25 Specifying Input Image Information for a Multi-Image Batch Job
In the Multiple Images Input step, configure the stream and click Finish.
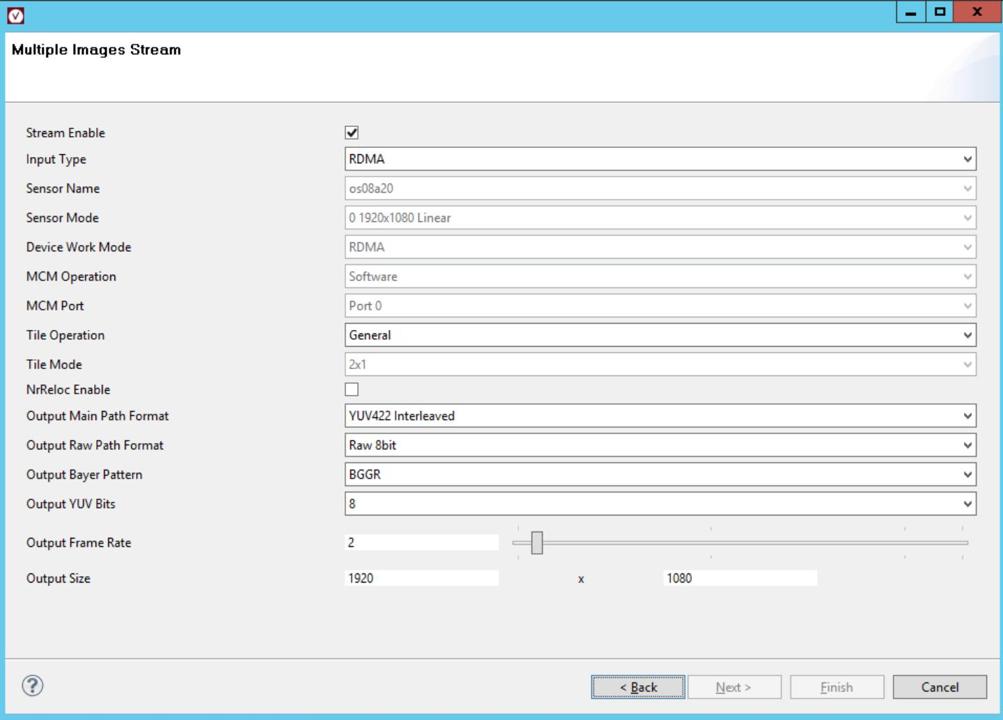
Figure 3.3‑26 Configuring the Stream for a Multi-Image Batch Job
For information on parameters in this step, refer to Configure Real-Time Preview.
Wait for the batch job to complete.
Operation Result
A result display page appears showing result images for each tuning task in the batch job, as shown in Figure 3.3‑17.
Result images from tuning tasks in the batch are saved in .jpg format to the directory specified by “Save Path”.
Managing Archived Batch Jobs
This task manages batch jobs archived in the isp_tuningtool.db database in the workspace.
Operation Steps
On the toolbar, click
 .
.
The Batch Job dialog appears.
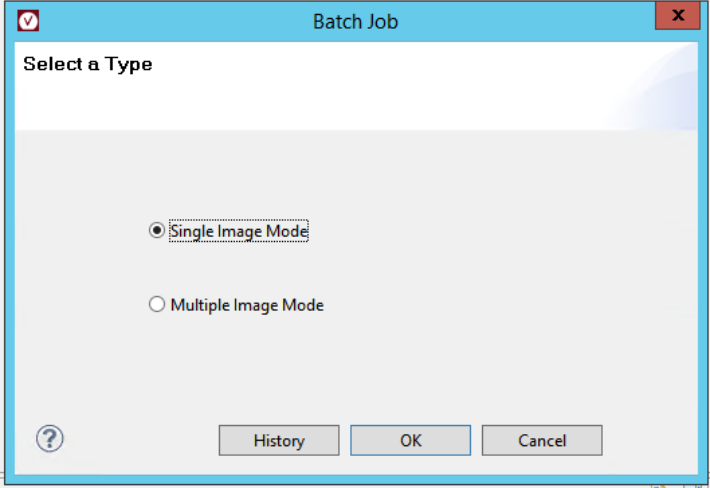
Figure 3.3‑27 Selecting a Mode for a Batch Job
Click the “History” button.
The Batch History dialog appears, displaying a table listing batch jobs archived in the database. The table includes job details such as job ID, number of tasks in the job, job status, and job creation time.
Possible values for job status include:
0: Created but not started
1: Started but not completed
2: Completed
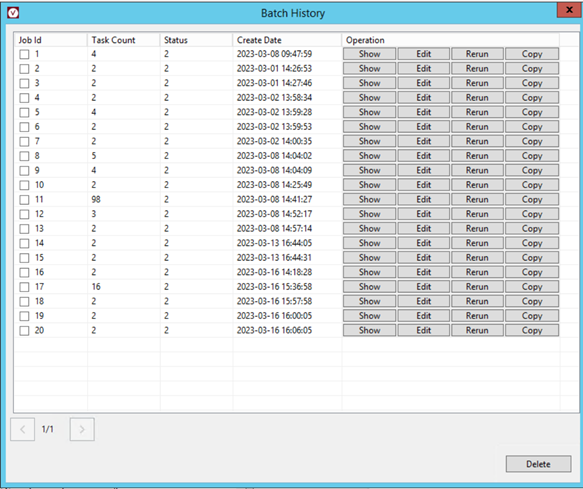
Figure 3.3‑28 Example of Batch History Dialog
Manage batch jobs as follows:
To view results of batch jobs with non-zero status, click “Show” in the “Operation” column.
To view and edit the configuration of a batch job and run it as a new job, click “Edit” in the “Operation” column.
The new job is assigned a new ID. Its status value is initialized to 1 and changes to 2 upon completion.
3) To run a batch job as a new job without changing its configuration, click "**Rerun**" in the "**Operation**" column. The new job is assigned a new ID. Its status value is initialized to 1 and changes to 2 upon completion.

4) To copy a batch job as a new job without running it, click "**Copy**" in the "**Operation**" column.
The new job is assigned a new ID. Its status value is 0.
5) To delete a batch job, select the corresponding checkbox in the "**Job Id**" column and click "**Delete**" at the lower-right corner.
After deletion, the tuning results of the batch job are also deleted.
Note: For multi-image batch jobs, the “Edit”, “Rerun”, and “Copy” buttons are unavailable.
Custom Configuration
Define Modules and Parameters Displayed in VTunerClient
This section describes how to customize VTunerClient configurations to meet specific requirements.
Prerequisites
Ensure that the VTunerClient workstation is connected to the board. For instructions, refer to Section 3.1.3.
Operation Steps
(Recommended) Back up the isp_modules.json file in the working directory.
Open and edit the isp_modules.json file to:
Remove certain modules or parameters.
Modify the display order of modules or parameters.
Modify the display names of modules, groups, or parameters.
Group some parameters into a new module.
Collaborate with the Tuning Server to add modules or parameters.
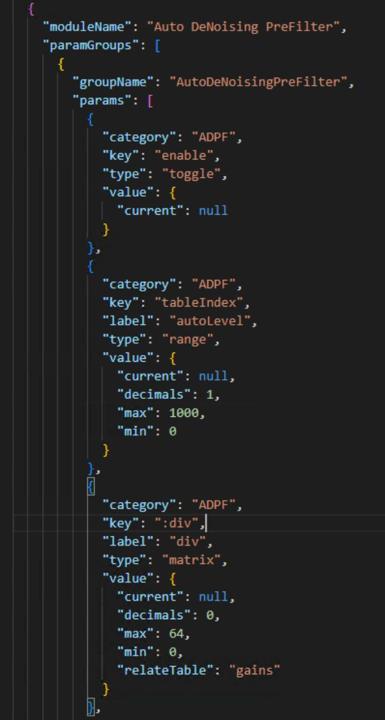
Figure 3.4‑1 isp_modules.json Example
In the isp_modules.json file:
moduleName defines the name of the module.
paramGroups includes an array where each item defines a parameter group.
params includes an array where each item defines a set of parameters within a group.
label is the parameter name displayed on the workstation.> If no label is specified, the workbench will display the value of the key.
type defines the parameter type.
For more information, see Section 3.2.4.2, Parameter Types.
Delete and recreate the existing project to activate the custom settings.
Operation Result
The Features list in the functional module and the detailed information of each parameter module can be updated according to the customization.
Customizing Sensor Information
This section describes editing the isp_sensor.json file in the workspace to customize sensor information—including sensor name and sensor modes—for configuring real-time preview.
Prerequisites
Ensure that a workspace has been created as instructed in Launching the VTunerClient Workbench.
Procedure
(Recommended) Back up the isp_sensor.json file in the working directory.
Open and edit the isp_sensor.json file.
In the isp_sensor.json file:
sensorName defines the name of the sensor. It is recommended to use the same sensor name as on the Tuning Server side.
Mode contains an array where each item defines a sensor mode.
af indicates whether the sensor supports the PDAF or CDAF module.
bayerPattern indicates the output Bayer pattern.
bitWidth indicates the bit depth of the output format.
fps indicates the output frame rate.
hdr indicates the linear/HDR mode.
Valid values: Linear, Native HDR, and Stitch HDR.
size indicates the output resolution in pixels.
integrationTime indicates the time required to expose a certain number of rows, in microseconds. The number of measured rows depends on the sensor configuration.
aGain indicates the analog gain.
dGain indicates the digital gain.
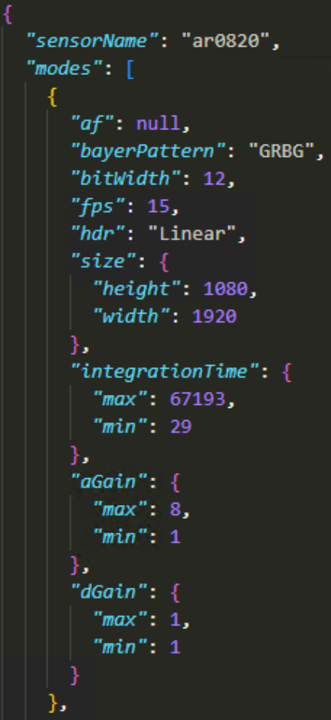
Figure 3.4‑2 Example of isp_sensor.json
Operation Result
Based on the customization, the options in the sensor name and sensor mode dropdown lists will be updated.
Note: The above settings must be applied each time after launching the VtuneClient tool and connecting to the Server—set Input Type to sensor and select the correct, already-added sensor in SensorName. This determines the accuracy and constraints of communication with the driver. AE Manual control and ROI window settings both depend on this configuration. If you upgrade to a new version of the Vtuner tool, files in the working directory will be cleared. It is recommended to back up the isp_sensor.json file before installing the new version.
Customizing TCP/UART Timeout and Dump Configuration
This section describes editing the isp_config.ini file in the workspace to customize TCP/UART timeout and dump configurations.
Prerequisites
Ensure that a workspace has been created as instructed in Launching the VTunerClient Workbench.
Procedure
Open and edit the isp_config.ini file in the working directory.
In the isp_config.ini file, you can set the following fields according to your network conditions:
isCapturable
Set to false to determine whether the following two modules can be used.
For information about ROI matrix parameters, see Section 3.2.4.2.5, ROI Matrix Parameters.
For information about the AWB tool, see Section 3.2.1.2.1, AWB Tool.
tcp.controlTimeout
Defines the timeout (in seconds) for each command when using a TCP connection.
tcp.streamTimeout
Defines the timeout (in seconds) for the YUV preview stream when using a TCP connection.
tcp.injectPort
Defines the port for the image injection channel over a TCP connection.
tcp.rawStreamPort
Defines the port for the raw data dump channel over a TCP connection.
tcp.statisticsPort
Defines the port for the statistics channel over a TCP connection.
tcp.streamPort
Defines the port for the YUV stream channel over a TCP connection.
tcp.isDump
Defines whether to save preview images received from the stream port when Sensor is selected as Input Type and a TCP connection is used.
The preview image dump feature is only available when the ISP output is in YUV format.
tcp.dumpNumber
Defines the number of preview images to save when Sensor is selected as Input Type and a TCP connection is used.
Images will be saved to the ./output directory within the workspace.
uart.controlTimeout
Defines the timeout (in seconds) for each command when using a UART connection.
5.17.10.5. Appendix A
This appendix lists the terms used in the X5 tool documentation, along with their full names and definitions.
| Term | Description |
|---|---|
| AWB | Auto White Balance |
| FPGA | field-programmable gate array |
| FPS | frames per second |
| GUI | graphical user interface |
| HDR | high dynamic range |
| HTTP | Hypertext Transfer Protocol |
| HW | hardware |
| ISP | Image Signal Processing |
| OS | operating system |
| PC | personal computer |
| PQ | picture quality |
| SDK | software development kit |
| SW | software |
| TCP | Transmission Control Protocol |
| UART | Universal Asynchronous Receiver-Transmitter |
| UI | user interface |
| URL | Uniform Resource Locator |