4.7.3. perf
perf is an open-source performance analysis tool used for performance monitoring and analysis on Linux systems. It provides a variety of subcommands for different performance analysis scenarios, such as recording, analyzing, and statistical profiling.
4.7.3.1. Syntax Description
Below is the Usage output from executing perf --help:
usage: perf [--version] [--help] [OPTIONS] COMMAND [ARGS]
4.7.3.2. Parameter Options Description
perf supports multiple subcommands, each with its specific purpose. Below are some commonly used subcommands and their descriptions:
annotate
   Purpose: Parse the perf.data file generated by perf record and display annotated code.
archive
   Purpose: Package all sampled ELF files based on the build-id recorded in the data file. This archive can be used to analyze sampling data on any machine.
bench
   Purpose: Built-in benchmark suite in perf, currently including two sets of benchmarks targeting the scheduler and memory management subsystems.
buildid-cache
   Purpose: Manage perf's buildid cache. Each ELF file has a unique buildid, which perf uses to associate performance data with ELF files.
buildid-list
   Purpose: List all buildids recorded in the data file.
diff
   Purpose: Compare differences between two data files. It can show specific differences for each symbol (function) in hotspot analysis.
evlist
   Purpose: List all performance events recorded in the perf.data file.
inject
   Purpose: This tool reads the event stream recorded by perf record and redirects it to standard output. Additional events can be injected into the event stream at any point in the analyzed code.
kmem
   Purpose: Tool for tracing and measuring the kernel memory (slab) subsystem.
kvm
   Purpose: Used to trace and test Guest OS running on KVM virtual machines.
list
   Purpose: List all performance events supported by the current system, including hardware performance events, software performance events, and tracepoints.
lock
   Purpose: Analyze lock information in the kernel, including lock contention and waiting latency.
mem
   Purpose: Memory access behavior.
record
   Purpose: Collect sampling information and record it in a data file. The data file can later be analyzed using other tools.
report
   Purpose: Read the data file created by perf record and provide hotspot analysis results.
sched
   Purpose: Analysis tool for the scheduler subsystem.
script
   Purpose: Execute Perl or Python extension scripts, generate script templates, read data from data files, etc.
stat
   Purpose: Execute a command and collect performance statistics for a specific process, including CPI, cache miss rate, etc.
test
   Purpose: Perform sanity testing of the current software and hardware platform. Use this tool to verify whether the current platform supports all perf features.
timechart
   Purpose: Visualization tool for system behavior during testing.
top
   Purpose: Similar to Linux's top command, provides real-time system performance analysis.
trace
   Purpose: Tool related to system calls.
probe
   Purpose: Used to define dynamic tracepoints.
Global Overview:
perf list
   Purpose: View all performance events supported by the current system.
perf bench
   Purpose: Benchmark system performance.
perf test
   Purpose: Perform sanity testing on the system.
perf stat
   Purpose: Statistically summarize overall system performance.
Global Details:
perf top
   Purpose: Real-time view of function CPU usage across the system.
perf probe
   Purpose: Define custom dynamic events.
Specific Function Analysis:
perf kmem
   Purpose: Performance analysis of the slab subsystem.
perf kvm
   Purpose: Analysis of KVM virtualization.
perf lock
   Purpose: Analyze lock performance.
perf mem
   Purpose: Analyze memory slab performance.
perf sched
   Purpose: Analyze kernel scheduler performance.
perf trace
   Purpose: Record system call traces.
Common Function: perf record
Can monitor system-wide, target a specific process, or even focus on a specific event within a process; can be macroscopic or highly microscopic.
perf record
   Purpose: Record information into perf.data.
perf report
   Purpose: Generate analysis reports.
perf diff
   Purpose: Compare two recorded data files.
perf evlist
   Purpose: List recorded performance events.
perf annotate
   Purpose: Display function code from perf.data.
perf archive
   Purpose: Package related symbols for convenient analysis on other machines.
Visualization Tool: perf timechart
perf timechart record
   Purpose: Record system events.
perf timechart
   Purpose: Generate output.svg file.
4.7.3.3. Command Options and Functional Descriptions
perf System Analysis
Command:
root@buildroot:~# perf top
Function:
Real-time display of functions or instructions consuming the most CPU cycles (useful for identifying hot functions).
Output:
  PerfTop:    1109 irqs/sec  kernel:58.4%  exact:  0.0% lost: 0/0 drop: 0/0 [4000Hz cycles],  (all, 8 CPUs)
-------------------------------------------------------------------------------------------------------------------------------------------------------------

     7.52%  perf              [.] 0x00000000000d7930
     5.45%  libc.so.6         [.] strchr
     5.23%  [kernel]          [k] format_decode
     5.15%  [kernel]          [k] number
     3.81%  [kernel]          [k] vsnprintf
     3.43%  [kernel]          [k] kallsyms_expand_symbol.constprop.0
     3.08%  [kernel]          [k] string
     2.16%  [kernel]          [k] module_get_kallsym
     2.03%  libc.so.6         [.] __libc_calloc
     1.60%  perf              [.] 0x00000000000e1974
Field Explanation:
1109 irqs/sec: Interrupt frequency, 1109 times per second.
kernel: Kernel-space CPU usage: 58.4%.
exact: Proportion of sampled events that precisely match hardware counters; 0.0% means all events were accurately recorded.
lost: Number of events lost during sampling (here 0).
drop: Number of events dropped by the kernel due to buffer overflow (here 0).
Each line contains four columns:
Overhead: Percentage of this symbol’s performance events among all samples.
Shared: Dynamic shared object (DSO) where the function or instruction resides, such as kernel, process name, shared library, or kernel module.
Object: Type of DSO.
[.]indicates user-space executable or shared library;[k]indicates kernel space.Symbol: Symbol name, i.e., function name. When unknown, shown as hexadecimal address.
perf Event Types
Command:
root@buildroot:~# perf list
Function:
Display all performance events supported by perf, which can be used for performance monitoring.
Output:
List of pre-defined events (to be used in -e or -M):

  branch-instructions OR branches                    [Hardware event]
  branch-misses                                      [Hardware event]
  bus-cycles                                         [Hardware event]
  cache-misses                                       [Hardware event]
  cache-references                                   [Hardware event]
  cpu-cycles OR cycles                               [Hardware event]
  instructions                                       [Hardware event]
  stalled-cycles-backend OR idle-cycles-backend      [Hardware event]
  stalled-cycles-frontend OR idle-cycles-frontend    [Hardware event]

  alignment-faults                                   [Software event]
  bpf-output                                         [Software event]
  cgroup-switches                                    [Software event]
  context-switches OR cs                             [Software event]
  cpu-clock                                          [Software event]
  cpu-migrations OR migrations                       [Software event]
  dummy                                              [Software event]
  emulation-faults                                   [Software event]
  major-faults                                       [Software event]
  minor-faults                                       [Software event]
  page-faults OR faults                              [Software event]
  task-clock                                         [Software event]

  duration_time                                      [Tool event]
  user_time                                          [Tool event]
  system_time                                        [Tool event]

  L1-dcache-load-misses                              [Hardware cache event]
  L1-dcache-loads                                    [Hardware cache event]
  L1-icache-load-misses                              [Hardware cache event]
  L1-icache-loads                                    [Hardware cache event]
  LLC-load-misses                                    [Hardware cache event]
  LLC-loads                                          [Hardware cache event]
  branch-load-misses                                 [Hardware cache event]
  branch-loads                                       [Hardware cache event]
  dTLB-load-misses                                   [Hardware cache event]
  dTLB-loads                                         [Hardware cache event]
  iTLB-load-misses                                   [Hardware cache event]
  iTLB-loads                                         [Hardware cache event]

  br_immed_retired OR armv8_pmuv3/br_immed_retired/  [Kernel PMU event]
  br_mis_pred OR armv8_pmuv3/br_mis_pred/            [Kernel PMU event]
  br_mis_pred_retired OR armv8_pmuv3/br_mis_pred_retired/ [Kernel PMU event]
  br_pred OR armv8_pmuv3/br_pred/                    [Kernel PMU event]
  br_retired OR armv8_pmuv3/br_retired/              [Kernel PMU event]
  br_return_retired OR armv8_pmuv3/br_return_retired/ [Kernel PMU event]
Field Explanation:
Hardware Events
Purpose: Directly use CPU hardware performance counters to measure low-level hardware behavior.
Key Events:
cpu-cycles: Number of CPU clock cycles (measures compute-intensive tasks).
instructions: Number of executed instructions (combined with cycles to compute IPC, instructions per cycle).
branch-misses: Number of branch prediction misses (key metric for optimizing branch logic).
cache-misses: Number of cache misses.
Software Events
Purpose: Abstract events simulated by the kernel, not dependent on hardware counters.
Key Events:
context-switches: Number of context switches.
page-faults: Number of page faults.
cpu-migrations: Number of process migrations between CPU cores.
Hardware Cache Events
Purpose: Measure behavior across CPU cache levels (L1/L2/L3).
Key Events:
L1-dcache-load-misses: L1 data cache load misses.
LLC-load-misses: Last-level cache (L3) load misses (high values suggest need for memory access optimization).
iTLB-load-misses: Instruction TLB load misses.
Kernel PMU Events
Purpose: Architecture-specific hardware events.
Key Events:
br_mis_pred_retired: Number of retired mispredicted branch instructions.
br_retired: Total number of retired branch instructions (used to calculate branch misprediction rate).
Tool Events
Purpose: Abstract events defined by perf itself for time distribution statistics.
Key Events:
duration_time: Total execution time.
user_time: Time spent in user-space code.
system_time: Time spent in kernel-space code.
Specifying Performance Events:
-e :u // userspace
-e :k // kernel
-e :h // hypervisor
-e :G // guest counting (in KVM guests)
-e :H // host counting (not in KVM guests)
Command:
root@buildroot:~# perf top -e cycles:k
Function:
Display functions consuming the most CPU cycles in kernel and modules.
Output:
   PerfTop:      48 irqs/sec  kernel:100.0%  exact:  0.0% lost: 0/0 drop: 0/0 [4000Hz cycles:k],  (all, 8 CPUs)
-------------------------------------------------------------------------------------------------------------------------------------------------------------

     9.72%  [kernel]       [k] format_decode
     8.56%  [kernel]       [k] number
     7.23%  [kernel]       [k] kallsyms_expand_symbol.constprop.0
     7.20%  [kernel]       [k] vsnprintf
     4.84%  [kernel]       [k] string
     4.33%  [kernel]       [k] module_get_kallsym
     2.71%  [kernel]       [k] finish_task_switch.isra.0
     2.62%  [kernel]       [k] mas_spanning_rebalance.isra.0
     2.16%  [kernel]       [k] _raw_spin_unlock_irqrestore
     1.82%  [kernel]       [k] memmove
     1.26%  [kernel]       [k] pointer
     1.23%  [kernel]       [k] mab_mas_cp
     1.17%  [kernel]       [k] update_iter
     1.09%  [kernel]       [k] strscpy
     1.09%  [kernel]       [k] __slab_free.constprop.0
     1.08%  [kernel]       [k] memset
     1.07%  [kernel]       [k] mtree_range_walk
     1.04%  [kernel]       [k] mas_descend_adopt
     0.80%  [kernel]       [k] rcu_cblist_dequeue
     0.80%  [kernel]       [k] kmem_cache_free
     0.79%  [kernel]       [k] seq_read_iter
     0.74%  [kernel]       [k] kmem_cache_alloc_bulk
     0.72%  [kernel]       [k] do_raw_spin_unlock
     0.65%  [kernel]       [k] s_next
     0.65%  [kernel]       [k] mas_wr_walk_index.isra.0
     0.62%  [kernel]       [k] __might_resched
     0.62%  [kernel]       [k] perf_iterate_sb
     0.51%  libc.so.6      [.] __mprotect
     0.50%  [kernel]       [k] perf_event_mmap
     0.46%  [kernel]       [k] kmem_cache_free_bulk.part.0
perf Process Statistics
Used to analyze performance characteristics of a specified program. Input format:
perf stat [-e | --event=EVENT] [-a]

perf stat [-e | --event=EVENT] [-a] - []
Command:
root@buildroot:~# perf stat ls
Function:
Output includes execution time of ls and statistics for 10 performance events.
Output:
root@buildroot:/userdata# perf stat ls
all_in_one.signature  all_in_one.zip  gmsl  log  lost+found  perf.data  perf.txt  perf.unfold  startup.sh  tee

 Performance counter stats for 'ls':

              6.04 msec task-clock                       #    0.742 CPUs utilized
                 0      context-switches                 #    0.000 /sec
                 0      cpu-migrations                   #    0.000 /sec
               125      page-faults                      #   20.680 K/sec
           3605684      cycles                           #    0.597 GHz
           2112783      instructions                     #    0.59  insn per cycle
            250653      branches                         #   41.468 M/sec
             23909      branch-misses                    #    9.54% of all branches

       0.008141958 seconds time elapsed

       0.008350000 seconds user
       0.000000000 seconds sys
Field Explanation:
task-clock:
Actual processor time consumed by the task, in milliseconds.
context-switches:
Number of context switches.
cpu-migrations:
Number of processor migrations. Linux migrates tasks between CPUs under certain conditions to maintain load balancing across processors.
page-faults:
Number of page faults. Triggered when the requested page is not established, not in memory, or when the mapping between physical and virtual addresses is not set up.
cycles:
Number of processor cycles consumed.
instructions:
Number of instructions executed.
branches:
Number of branch instructions encountered.
branch-misses:
Number of mispredicted branch instructions.
Common perf stat Options
-p: Stat events on existing process ID (comma-separated list).
Purpose: Analyze only the target process and its threads.
-a: System-wide collection from all CPUs.
Purpose: Collect performance data from all CPUs.
-r: Repeat command and print average + standard deviation (max: 100).
Purpose: Repeat command execution and compute average.
-C: Count only on the list of CPUs provided (comma-separated list).
Purpose: Collect performance data from specified CPUs.
-v: Be more verbose (show counter open errors, etc).
Purpose: Display more detailed performance data.
-n: Null run — don’t start any counters.
Purpose: Only show task execution time.
-x SEP: Specify separator for output columns.
-o file: Specify output file.
Command:
root@buildroot:~# perf stat -r 10 ls > /dev/null
Function:
Execute the program 10 times and report the ratio of standard deviation to mean.
Output:
 Performance counter stats for 'ls' (10 runs):

              3.21 msec task-clock                       #    0.696 CPUs utilized            ( +-  7.72% )
                 0      context-switches                 #    0.000 /sec
                 0      cpu-migrations                   #    0.000 /sec
               121      page-faults                      #   35.452 K/sec                    ( +-  0.22% )
           3842788      cycles                           #    1.126 GHz                      ( +-  1.15% )
           2038097      instructions                     #    0.54  insn per cycle           ( +-  0.35% )
            239562      branches                         #   70.189 M/sec                    ( +-  0.29% )
             22215      branch-misses                    #    9.44% of all branches          ( +-  0.41% )

          0.004613 +- 0.000344 seconds time elapsed  ( +-  7.46% )
Field Explanation:
In the output of the performance testing tool perf stat, the ±x% in parentheses represents the standard deviation as a percentage of the mean, commonly known as the coefficient of variation (CV). It reflects the fluctuation range of the metric across multiple runs and is used to measure the stability and reliability of the data.
Command:
root@buildroot:~# perf stat -v ls > /dev/null
Function:
Display more detailed information.
Output:
Using CPUID 0x00000000410fd050
Control descriptor is not initialized
task-clock: 5669250 5669250 5669250
context-switches: 0 5669250 5669250
cpu-migrations: 0 5669250 5669250
page-faults: 120 5669250 5669250
cycles: 3390596 5666583 5666583
instructions: 2003447 5666583 5666583
branches: 237261 5666583 5666583
branch-misses: 22209 5666583 5666583

 Performance counter stats for 'ls':

              5.67 msec task-clock                       #    0.732 CPUs utilized
                 0      context-switches                 #    0.000 /sec
                 0      cpu-migrations                   #    0.000 /sec
               120      page-faults                      #   21.167 K/sec
           3390596      cycles                           #    0.598 GHz
           2003447      instructions                     #    0.59  insn per cycle
            237261      branches                         #   41.851 M/sec
             22209      branch-misses                    #    9.36% of all branches

       0.007745041 seconds time elapsed

       0.007955000 seconds user
       0.000000000 seconds sys
Command:
root@buildroot:~# perf stat -n ls > /dev/null
Function:
Only display task execution time, without showing performance counters.
Output:
 Performance counter stats for 'ls':

       0.003568084 seconds time elapsed

       0.003818000 seconds user
       0.000000000 seconds sys
Command:
root@buildroot:~# perf stat -a -A ls > /dev/null
Function:
Display information for each individual CPU.
Output:
root@buildroot:~# perf stat -a -A ls > /dev/null

 Performance counter stats for 'system wide':

CPU0                     4.24 msec cpu-clock                        #    1.042 CPUs utilized
CPU1                     4.21 msec cpu-clock                        #    1.034 CPUs utilized
CPU2                     4.19 msec cpu-clock                        #    1.029 CPUs utilized
CPU3                     4.16 msec cpu-clock                        #    1.024 CPUs utilized
CPU4                     4.15 msec cpu-clock                        #    1.020 CPUs utilized
CPU5                     4.14 msec cpu-clock                        #    1.017 CPUs utilized
CPU6                     4.13 msec cpu-clock                        #    1.016 CPUs utilized
CPU7                     4.11 msec cpu-clock                        #    1.010 CPUs utilized
CPU0                        3      context-switches                 #  708.159 /sec
CPU1                        3      context-switches                 #  713.225 /sec
CPU2                        3      context-switches                 #  716.625 /sec
CPU3                        3      context-switches                 #  720.295 /sec
CPU4                        3      context-switches                 #  723.117 /sec
CPU5                        5      context-switches                 #    1.208 K/sec
CPU6                        3      context-switches                 #  726.194 /sec
CPU7                        5      context-switches                 #    1.217 K/sec
CPU0                        1      cpu-migrations                   #  236.053 /sec
CPU1                        1      cpu-migrations                   #  237.742 /sec
CPU2                        1      cpu-migrations                   #  238.875 /sec
CPU3                        1      cpu-migrations                   #  240.098 /sec
CPU4                        1      cpu-migrations                   #  241.039 /sec
CPU5                        1      cpu-migrations                   #  241.687 /sec
CPU6                        1      cpu-migrations                   #  242.065 /sec
CPU7                        1      cpu-migrations                   #  243.408 /sec
perf record - Collect Information
Collect sampling data and record it into a data file. The data file can later be analyzed using other tools (e.g., perf-report).
Common Options:
The perf record command has many available options. Below are commonly used ones. For the complete list, run perf record -h.
-a: Analyze system-wide performance
-A: Append output to the output file
-c: Sampling period for events
-C: Monitor only specified CPU(s)
-e: Select performance events, which can be hardware or software events
-f: Overwrite the output file
-g: Record function call chains
-o: Specify output file; default is perf.data
-p: Specify a process ID to collect data for a specific process
-t: Specify a thread ID to collect data for a specific thread
Command:
root@buildroot:~# perf record -a -F 1000 sleep 5
Function:
Sample events across all CPUs at a frequency of 1000 Hz during a 5-second sleep period.
Command:
root@buildroot:~# perf record -p xxx -g
Function:
Monitor the process with PID=xxx, record call chains, and save output to the default file perf.data.
root@buildroot:~# perf record -p xxx -g -o pidxxx.data
Function:
Monitor the process with PID=xxx, record call chains, and save output to pidxxx.data.
perf report - Analyze Results
perf report analyzes the data file generated by perf record.
Common Options:
The perf report command has many available options. Below are commonly used ones. For the complete list, run perf report -h.
-c: Specify sampling period
-C: Display information for specified CPU only
-d: Display symbols for specified DOS only
-g: Generate function call graph, equivalent to the
-goption inperf top-i: Input data file name; default is perf.data
-M: Display assembly instructions in specified syntax style
–sort: Sort statistics by criteria such as PID, COMM, CPU, etc.
-S: Consider only specified symbols
-U: Display only resolved symbols
-v: Show address for each symbol
Command:
root@buildroot:~# perf report -i perf.data
Function:
Analyze the data file generated by perf record.
Output:
# To display the perf.data header info, please use --header/--header-only options.
#
#
# Total Lost Samples: 0
#
# Samples: 505  of event 'cycles'
# Event count (approx.): 16387804
#
# Children      Self  Command          Shared Object      Symbol
# ........  ........  ...............  .................  ........................................
  [[31m  72.50%[[m     0.00%  swapper          [kernel.kallsyms]  [k] cpu_startup_entry
            |
            ---cpu_startup_entry
               |
                --[[31m71.81%[[m--do_idle
                          |
                          |--[[31m46.64%[[m--default_idle_call
                          |          |
                          |           --[[31m46.21%[[m--arch_cpu_idle
                          |                     |
                          |                      --[[31m14.86%[[m--el1h_64_irq
                          |                                el1h_64_irq_handler
                          |                                el1_interrupt
                          |                                irq_exit_rcu
                          |                                __irq_exit_rcu
                          |                                do_softirq_own_stack
                          |                                call_on_irq_stack
                          |                                ____do_softirq
                          |                                __softirqentry_text_start
                          |                                |
                          |                                |--[[31m6.68%[[m--run_timer_softirq
                          |                                |          |
                          |                                |           --[[31m6.34%[[m--__run_timers.part.0
                          |                                |                     |
                          |                                |                     |--[[32m3.45%[[m--call_timer_fn.constprop.0
                          |                                |                     |          |
                          |                                |                     |          |--[[32m1.72%[[m--process_timeout
                          |                                |                     |          |          wake_up_process
                          |                                |                     |          |          try_to_wake_up
                          |                                |                     |          |          _raw_spin_unlock_irqrestore
                          |                                |                     |          |
                          |                                |                     |           --[[32m0.86%[[m--tcp_orphan_update
                          |                                |                     |
                          |                                |                      --[[32m2.89%[[m--_raw_spin_unlock_irq
                          |                                |
                          |                                |--[[32m4.39%[[m--run_rebalance_domains
                          |                                |          |
                          |                                |          |--[[32m2.50%[[m--rebalance_domains
                          |                                |          |          |
                          |                                |          |           --[[32m2.10%[[m--load_balance
                          |                                |          |                     |
                          |                                |          |                      --[[32m0.75%[[m--find_busiest_group
                          |                                |          |
                          |                                |           --[[32m1.89%[[m--update_blocked_averages
                          |                                |
                          |                                 --[[32m1.59%[[m--rcu_core_si
                          |                                           |
                          |                                           |--[[32m0.90%[[m--file_free_rcu
                          |                                           |
                          |                                            --[[32m0.57%[[m--rcu_core
                          |
                          |--[[31m10.88%[[m--schedule_idle
                          |          __schedule
                          |          finish_task_switch.isra.0
                          |
                          |--[[31m8.46%[[m--nohz_run_idle_balance
                          |          |
                          |          |--[[31m7.71%[[m--_nohz_idle_balance.isra.0
                          |          |          |
                          |          |           --[[32m3.49%[[m--update_blocked_averages
                          |          |
                          |           --[[32m0.52%[[m--_find_next_bit
                          |
                           --[[32m4.75%[[m--tick_nohz_idle_exit
Generate Flame Graph with perf
Step 1
In the xbuild compilation system, use the following command to help users configure kernel options. This command automatically uses the kernel configuration file set in the board configuration file. After configuration, it automatically runs savedefconfig and saves the configuration. Enter the command as follows:
./bd.sh boot menuconfig
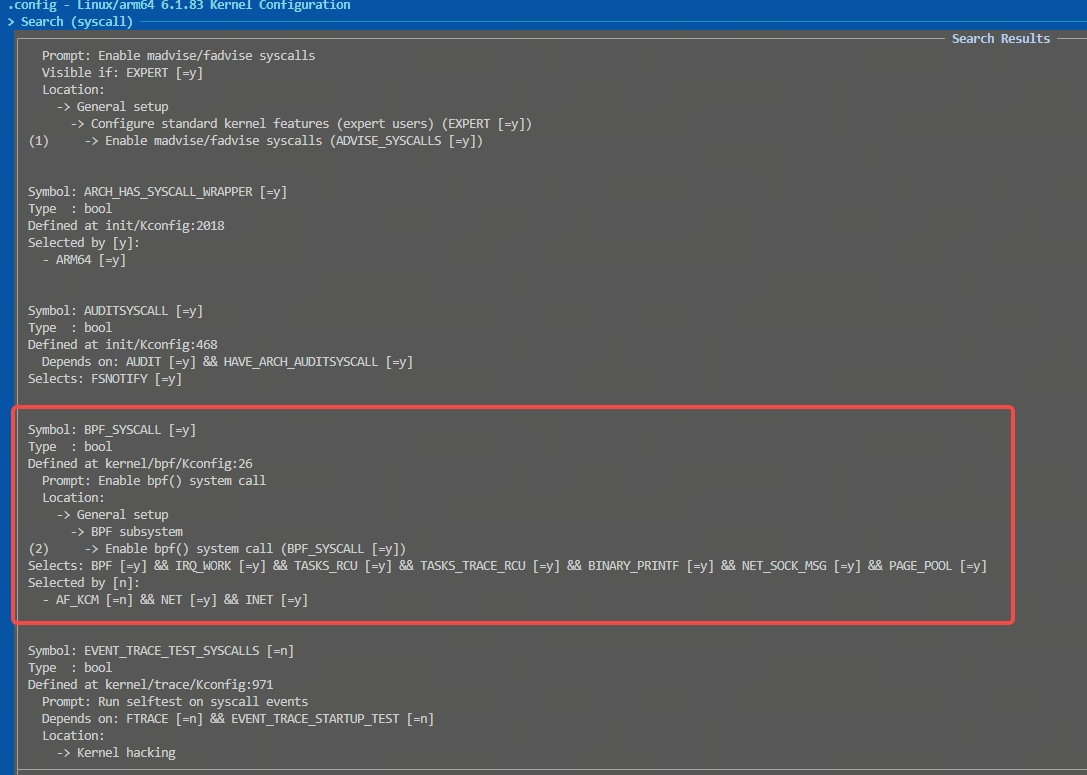
Enable BPF_SYSCALL, save the configuration, and recompile and flash the kernel.
Step 2
Use the perf script tool to parse perf.data:
perf script -i perf.data &> perf.unfold
Step 3
Download the FlameGraph tool using git:
git clone https://github.com/brendangregg/FlameGraph.git
After downloading and extracting, the directory structure is as follows:
├── README.md
├── aix-perf.pl
├── demos
│   ├── README
│   ├── brkbytes-mysql.svg
│   ├── cpu-grep.svg
│   ├── cpu-illumos-ipdce.svg
│   ├── cpu-illumos-syscalls.svg
│   ├── cpu-illumos-tcpfuse.svg
│   ├── cpu-iozone.svg
│   ├── cpu-ipnet-diff.svg
│   ├── cpu-linux-tar.svg
│   ├── cpu-linux-tcpsend.svg
│   ├── cpu-mixedmode-flamegraph-java.svg
│   ├── cpu-mysql-filt.svg
│   ├── cpu-mysql.svg
│   ├── cpu-qemu-both.svg
│   ├── cpu-zoomable.html
│   ├── hotcold-kernelthread.svg
│   ├── io-gzip.svg
│   ├── io-mysql.svg
│   ├── mallocbytes-bash.svg
│   ├── off-bash.svg
│   ├── off-mysql-busy.svg
│   ├── off-mysql-idle.svg
│   ├── palette-example-broken.svg
│   └── palette-example-working.svg
├── dev
│   ├── README
│   ├── gatherhc-kern.d
│   ├── gatherthc-kern.d
│   ├── hcstackcollapse.pl
│   ├── hotcoldgraph.pl
│   └── thcstackcollapse.pl
├── difffolded.pl
├── docs
│   └── cddl1.txt
├── example-dtrace-stacks.txt
├── example-dtrace.svg
├── example-perf-stacks.txt.gz
├── example-perf.svg
├── files.pl
├── flamegraph.pl
├── jmaps
├── perf.folded
├── perf.svg
├── perf.unfold
├── pkgsplit-perf.pl
├── range-perf.pl
├── record-test.sh
├── stackcollapse-aix.pl
├── stackcollapse-bpftrace.pl
├── stackcollapse-chrome-tracing.py
├── stackcollapse-elfutils.pl
├── stackcollapse-faulthandler.pl
├── stackcollapse-gdb.pl
├── stackcollapse-go.pl
├── stackcollapse-ibmjava.pl
├── stackcollapse-instruments.pl
├── stackcollapse-java-exceptions.pl
├── stackcollapse-jstack.pl
├── stackcollapse-ljp.awk
├── stackcollapse-perf-sched.awk
├── stackcollapse-perf.pl
├── stackcollapse-pmc.pl
├── stackcollapse-recursive.pl
├── stackcollapse-sample.awk
├── stackcollapse-stap.pl
├── stackcollapse-vsprof.pl
├── stackcollapse-vtune-mc.pl
├── stackcollapse-vtune.pl
├── stackcollapse-wcp.pl
├── stackcollapse-xdebug.php
├── stackcollapse.pl
├── test
│   ├── perf-cycles-instructions-01.txt
│   ├── perf-dd-stacks-01.txt
│   ├── perf-funcab-cmd-01.txt
│   ├── perf-funcab-pid-01.txt
│   ├── perf-iperf-stacks-pidtid-01.txt
│   ├── perf-java-faults-01.txt
│   ├── perf-java-stacks-01.txt
│   ├── perf-java-stacks-02.txt
│   ├── perf-js-stacks-01.txt
│   ├── perf-mirageos-stacks-01.txt
│   ├── perf-numa-stacks-01.txt
│   ├── perf-rust-Yamakaky-dcpu.txt
│   ├── perf-vertx-stacks-01.txt
│   └── results
│       ├── perf-cycles-instructions-01-collapsed-addrs.txt
│       ├── perf-cycles-instructions-01-collapsed-all.txt
│       ├── perf-cycles-instructions-01-collapsed-jit.txt
│       ├── perf-cycles-instructions-01-collapsed-kernel.txt
│       ├── perf-cycles-instructions-01-collapsed-pid.txt
│       ├── perf-cycles-instructions-01-collapsed-tid.txt
│       ├── perf-dd-stacks-01-collapsed-addrs.txt
│       ├── perf-dd-stacks-01-collapsed-all.txt
│       ├── perf-dd-stacks-01-collapsed-jit.txt
│       ├── perf-dd-stacks-01-collapsed-kernel.txt
│       ├── perf-dd-stacks-01-collapsed-pid.txt
│       ├── perf-dd-stacks-01-collapsed-tid.txt
│       ├── perf-funcab-cmd-01-collapsed-addrs.txt
│       ├── perf-funcab-cmd-01-collapsed-all.txt
│       ├── perf-funcab-cmd-01-collapsed-jit.txt
│       ├── perf-funcab-cmd-01-collapsed-kernel.txt
│       ├── perf-funcab-cmd-01-collapsed-pid.txt
│       ├── perf-funcab-cmd-01-collapsed-tid.txt
│       ├── perf-funcab-pid-01-collapsed-addrs.txt
│       ├── perf-funcab-pid-01-collapsed-all.txt
│       ├── perf-funcab-pid-01-collapsed-jit.txt
│       ├── perf-funcab-pid-01-collapsed-kernel.txt
│       ├── perf-funcab-pid-01-collapsed-pid.txt
│       ├── perf-funcab-pid-01-collapsed-tid.txt
│       ├── perf-iperf-stacks-pidtid-01-collapsed-addrs.txt
│       ├── perf-iperf-stacks-pidtid-01-collapsed-all.txt
│       ├── perf-iperf-stacks-pidtid-01-collapsed-jit.txt
│       ├── perf-iperf-stacks-pidtid-01-collapsed-kernel.txt
│       ├── perf-iperf-stacks-pidtid-01-collapsed-pid.txt
│       ├── perf-iperf-stacks-pidtid-01-collapsed-tid.txt
│       ├── perf-java-faults-01-collapsed-addrs.txt
│       ├── perf-java-faults-01-collapsed-all.txt
│       ├── perf-java-faults-01-collapsed-jit.txt
│       ├── perf-java-faults-01-collapsed-kernel.txt
│       ├── perf-java-faults-01-collapsed-pid.txt
│       ├── perf-java-faults-01-collapsed-tid.txt
│       ├── perf-java-stacks-01-collapsed-addrs.txt
│       ├── perf-java-stacks-01-collapsed-all.txt
│       ├── perf-java-stacks-01-collapsed-jit.txt
│       ├── perf-java-stacks-01-collapsed-kernel.txt
│       ├── perf-java-stacks-01-collapsed-pid.txt
│       ├── perf-java-stacks-01-collapsed-tid.txt
│       ├── perf-java-stacks-02-collapsed-addrs.txt
│       ├── perf-java-stacks-02-collapsed-all.txt
│       ├── perf-java-stacks-02-collapsed-jit.txt
│       ├── perf-java-stacks-02-collapsed-kernel.txt
│       ├── perf-java-stacks-02-collapsed-pid.txt
│       ├── perf-java-stacks-02-collapsed-tid.txt
│       ├── perf-js-stacks-01-collapsed-addrs.txt
│       ├── perf-js-stacks-01-collapsed-all.txt
│       ├── perf-js-stacks-01-collapsed-jit.txt
│       ├── perf-js-stacks-01-collapsed-kernel.txt
│       ├── perf-js-stacks-01-collapsed-pid.txt
│       ├── perf-js-stacks-01-collapsed-tid.txt
│       ├── perf-mirageos-stacks-01-collapsed-addrs.txt
│       ├── perf-mirageos-stacks-01-collapsed-all.txt
│       ├── perf-mirageos-stacks-01-collapsed-jit.txt
│       ├── perf-mirageos-stacks-01-collapsed-kernel.txt
│       ├── perf-mirageos-stacks-01-collapsed-pid.txt
│       ├── perf-mirageos-stacks-01-collapsed-tid.txt
│       ├── perf-numa-stacks-01-collapsed-addrs.txt
│       ├── perf-numa-stacks-01-collapsed-all.txt
│       ├── perf-numa-stacks-01-collapsed-jit.txt
│       ├── perf-numa-stacks-01-collapsed-kernel.txt
│       ├── perf-numa-stacks-01-collapsed-pid.txt
│       ├── perf-numa-stacks-01-collapsed-tid.txt
│       ├── perf-rust-Yamakaky-dcpu-collapsed-addrs.txt
│       ├── perf-rust-Yamakaky-dcpu-collapsed-all.txt
│       ├── perf-rust-Yamakaky-dcpu-collapsed-jit.txt
│       ├── perf-rust-Yamakaky-dcpu-collapsed-kernel.txt
│       ├── perf-rust-Yamakaky-dcpu-collapsed-pid.txt
│       ├── perf-rust-Yamakaky-dcpu-collapsed-tid.txt
│       ├── perf-vertx-stacks-01-collapsed-addrs.txt
│       ├── perf-vertx-stacks-01-collapsed-all.txt
│       ├── perf-vertx-stacks-01-collapsed-jit.txt
│       ├── perf-vertx-stacks-01-collapsed-kernel.txt
│       ├── perf-vertx-stacks-01-collapsed-pid.txt
│       └── perf-vertx-stacks-01-collapsed-tid.txt
└── test.sh
Place the perf.unfold file you wish to analyze into the extracted FlameGraph directory. Use the stackcollapse-perf.pl script to fold the symbols in perf.unfold.
./stackcollapse-perf.pl perf.unfold &> perf.folded
Step 4
Use the flamegraph.pl script to generate an SVG image.
./flamegraph.pl perf.folded > perf.svg
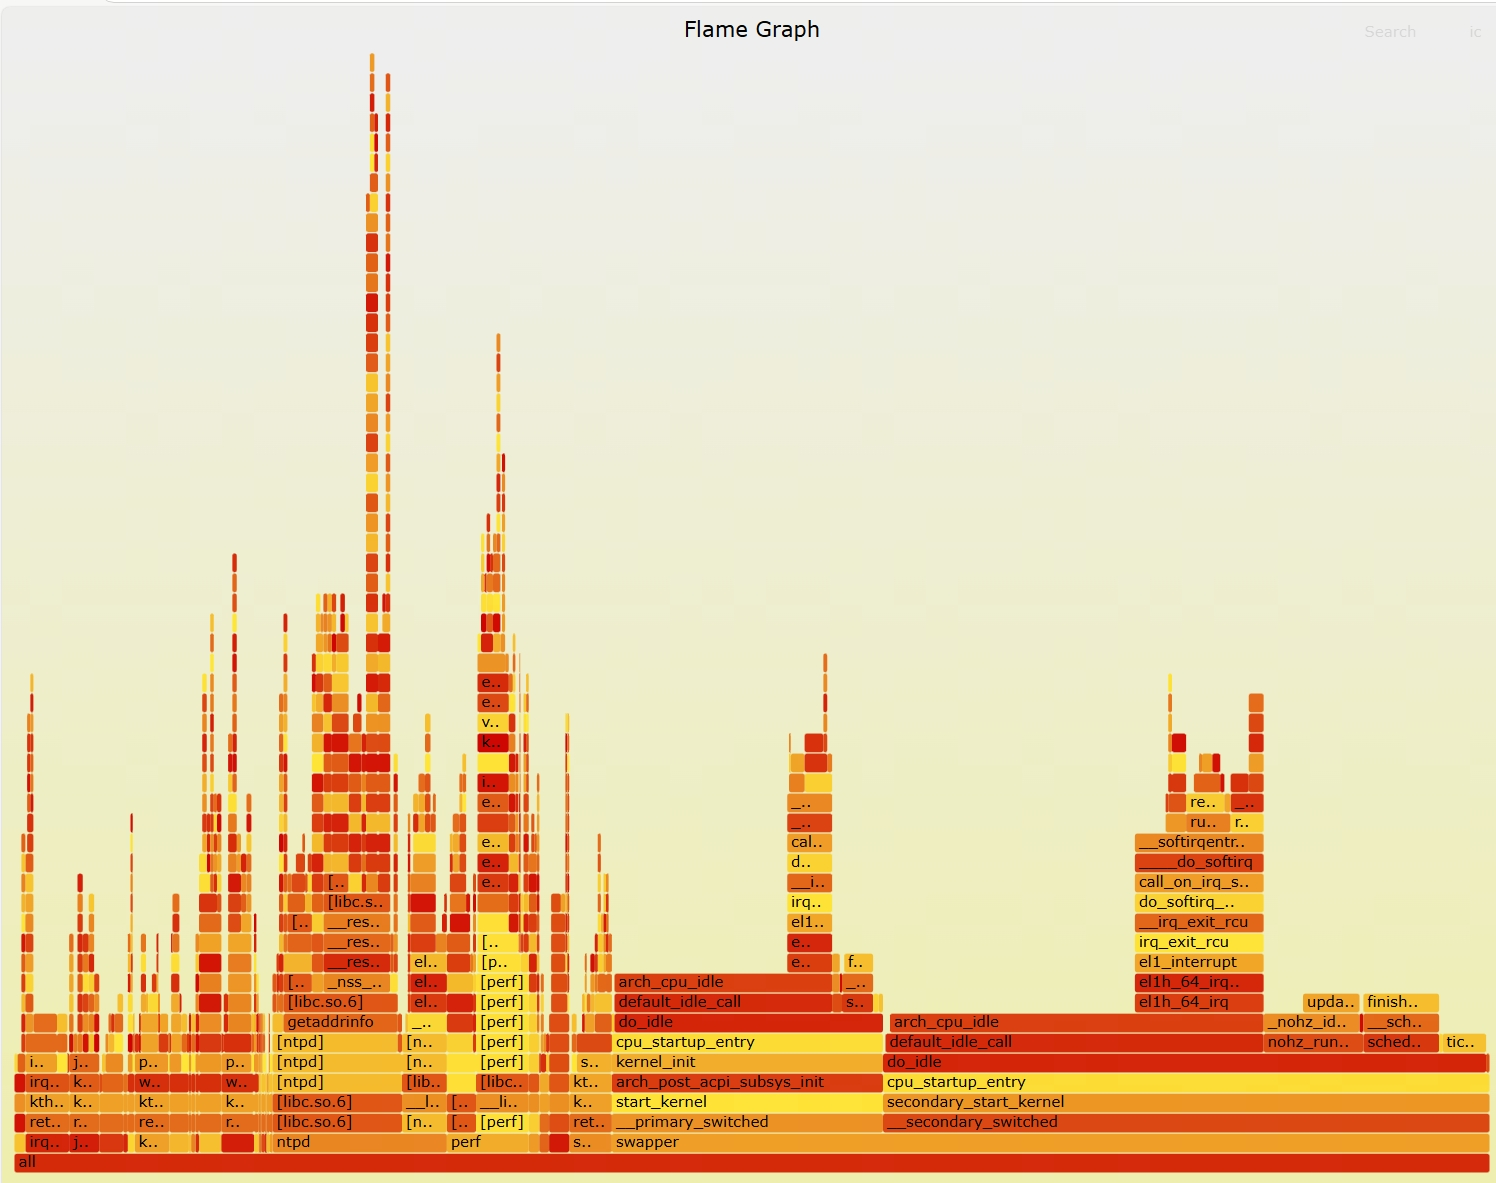
Open the resulting SVG file in Chrome or an image viewer. The generated flame graph looks like this:
Flame Graph Interpretation
Core Structure of Flame Graph
  X-axis (horizontal)
    - Represents CPU time distribution. Wider blocks indicate functions or code paths that consume a higher proportion of CPU time, potentially indicating performance bottlenecks.
    - All call stacks at the same level are displayed side by side; they do not represent chronological order.
  Y-axis (vertical)
    - Represents call stack depth. Functions are shown from bottom to top, illustrating the call hierarchy.
    - The bottom layer is the program entry point (e.g., main function), and upper layers represent currently executing functions.
  Colors and Blocks
    - Colors are typically used only to differentiate functions and have no fixed meaning.
    - Tall and wide "flat-topped" flames (where the same function appears multiple times at the top of the stack) are key targets for performance optimization.

Steps for Flame Graph Analysis
  Identify CPU Hotspots
    - Open the SVG flame graph and horizontally scan for the widest blocks to quickly identify functions consuming the most CPU time.
  Analyze Call Chains
    - Trace the call path from bottom to top through each layer to understand how hot functions are invoked.
  Correlate with iperf Operation Mode
    - Server-side flame graph: Focus on CPU overhead in receiving logic such as accept, recv.
    - Client-side flame graph: Focus on performance cost in sending logic such as connect, send.