6.3.5. Model Performance Analysis
This section describes how to evaluate model performance using the tools provided by D-Robotics. If the evaluation results are not found to be as expected at this stage, it is strongly recommended that you try to resolve performance issues at this stage by reading Model Performance Optimization section. It is not recommended to extend model problems into the application development phase.
6.3.5.1. Use the hb_perf Tool to Evaluate Model Performance
The hb_perf provided by D-Robotics takes the *.bin obtained from the model conversion as input and can directly obtain the expected on-board performance of the model. The tool is used as follows:
hb_perf ***.bin
Note
If you are intended to analyze the packed model after running the pack command,
you need to add a -p parameter and run hb_perf -p ***.bin.
For the pack command, please refer to the The hb_pack Tool section.
The *.bin in the command is the bin model of the model conversion output. After the command is executed, a hb_perf_result directory will be generated in the current working directory, and the analysis results will be provided in html format.
The following is a sample result of our analysis of a MobileNet, where mobilenetv1_224x224_nv12.html is the main page to view the analysis results.
hb_perf_result/
└── mobilenetv1_224x224_nv12
    ├── MOBILENET_subgraph_0.html
    ├── MOBILENET_subgraph_0.json
    ├── mobilenetv1_224x224_nv12
    ├── mobilenetv1_224x224_nv12.html
    ├── mobilenetv1_224x224_nv12.png
    └── temp.hbm
Open the main page using your web browser, you’ll see the following:
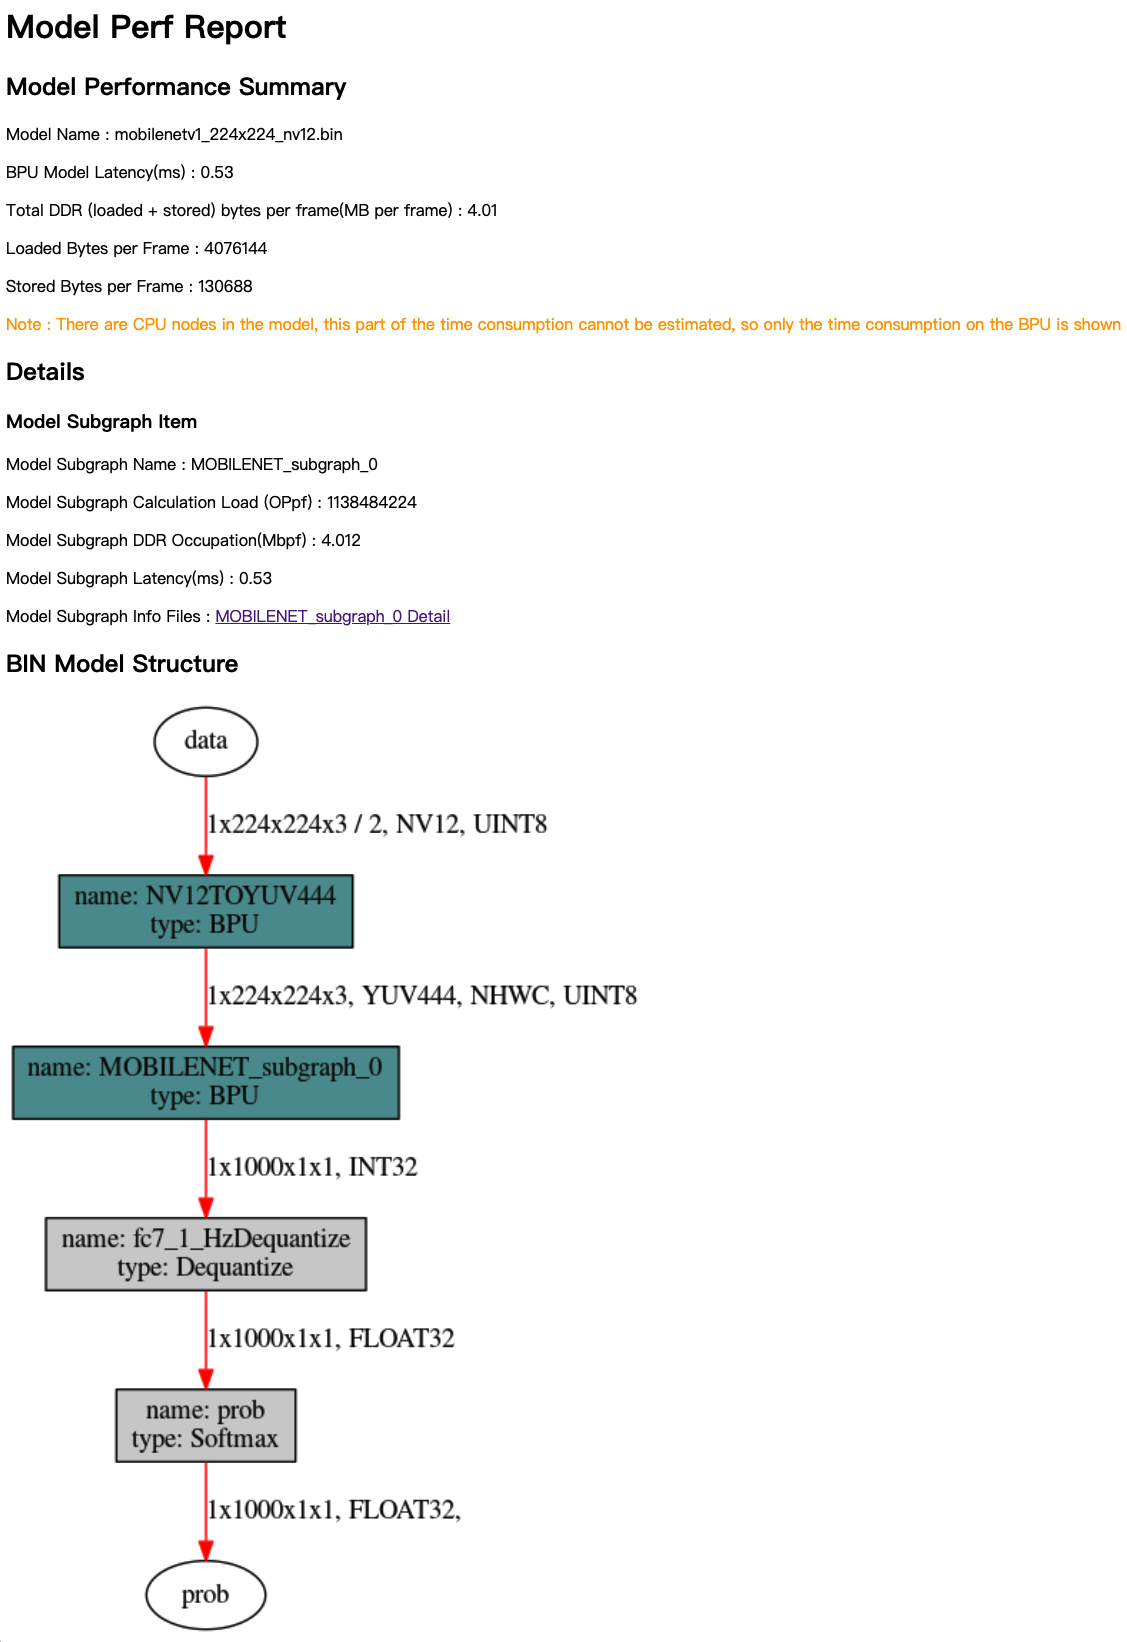
Analysis results consist of 3 parts: Model Performance Summary, Details and BIN Model Structure. Model Performance Summary is the overall performance evaluation result of the bin model. Wherein, the indicators represent respectively:
Model Name: model name.
Model Latency(ms): model’s overall time consumption of single frame computing (in ms).
Total DDR (loaded+stored) bytes per frame (MB per frame): total amount of DDR used for data loading and storage in the overall BPU part of the model (in MB/frame).
Loaded Bytes per Frame: model’s data loading volume per frame during execution.
Stored Bytes per Frame: model’s data storing volume per frame during execution.
You need to understand the concept of subgraph before learning Details and BIN Model Structure. If there are CPU computing OPs in the non-input or output part of the model, the model conversion tool will split the OP’s continuous BPU computing part into 2 independent subgraphs. For details, please refer to the Check the Model section.
Details refers to the detailed information of each model’s BPU subgraph(s). The indicators of each subgraph in the main page are shown as below:
Model Subgraph Name: name of the subgraph.
Model Subgraph Calculation Load (OPpf): single frame computing load of the subgraph.
Model Subgraph DDR Occupation(Mbpf): single frame loading/writing volume (in MB) of the subgraph.
Model Subgraph Latency(ms): single frame computing time consumption of a the subgraph (in ms).
Each subgraph provides a detailed page, in which you can get more specific information. All the above indicators are obtained from the detailed page.
Attention
Note that the detail page will differ depending on whether you have the debug parameter (debug) enabled or not.
In below, the Layer Details can only be obtained when the debug
parameter in the configuration file is specified as True.
For the configuration of the debug parameter please refer to
the description of it in Compilation Parameters section.
BIN Model Structure is a subgraph level visualization results of bin model, in which the nodes in dark color represent those subgraphs run on the BPU; while the nodes in gray represent those nodes computed in CPU.
Layer Details analyzes specific OP-level information, it is a useful reference in the debugging and analysis stage, especially when there is low model performance problem caused by BPU OPs, it can help you find the problematic OPs.
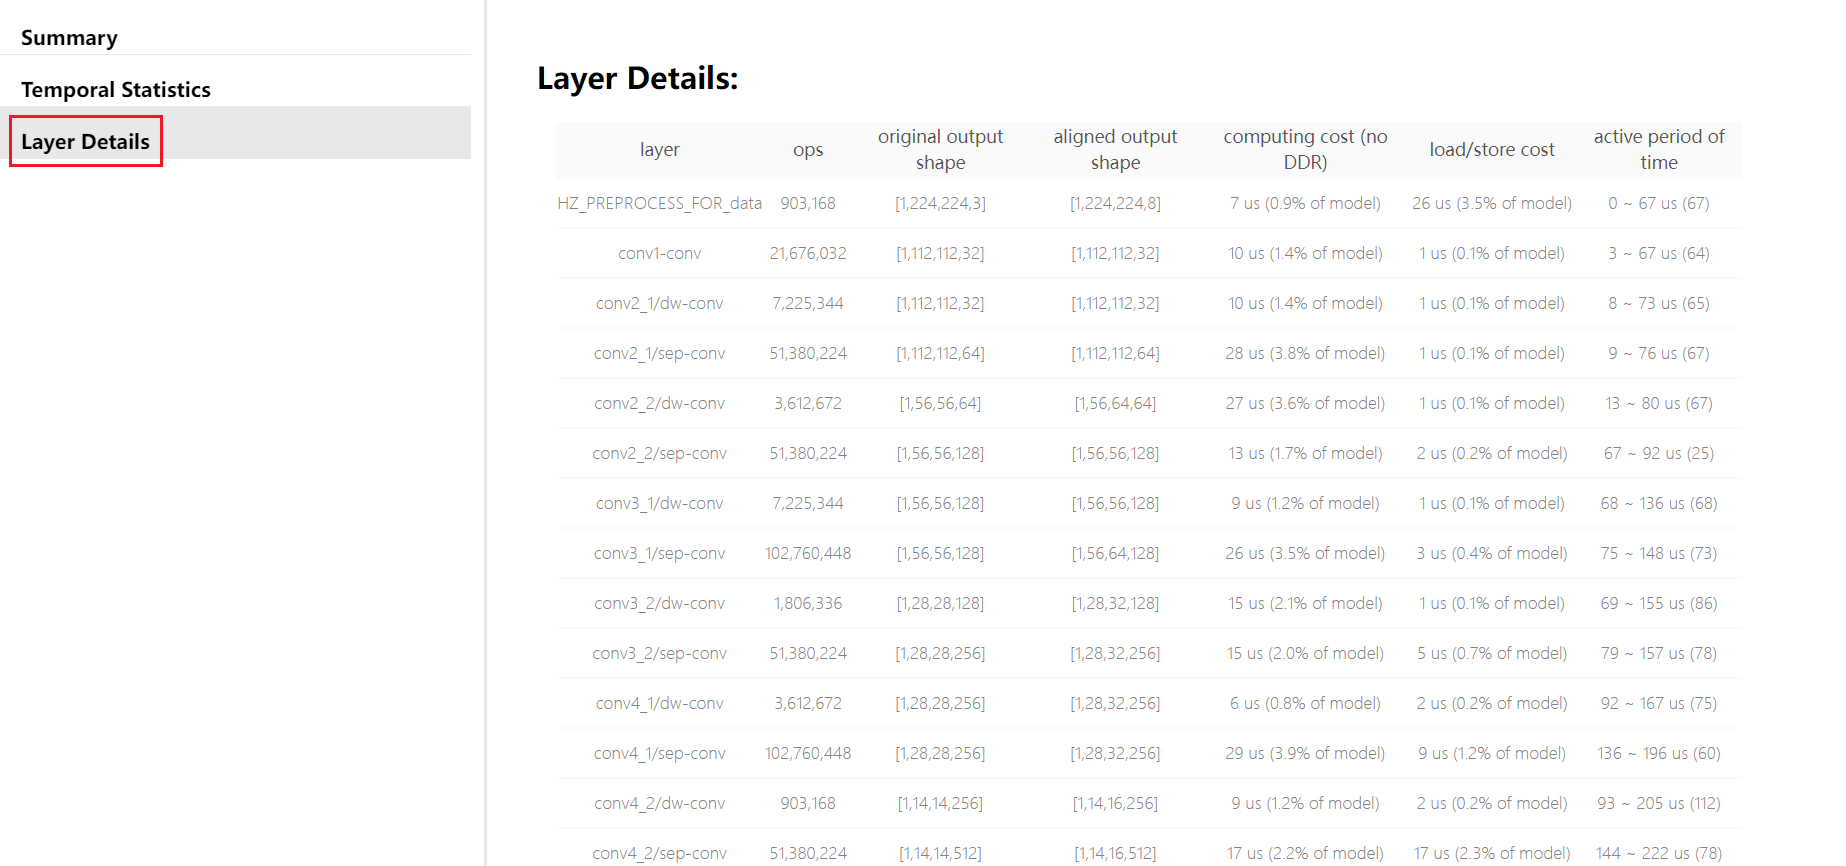
Of these, each indicator is explained below:
layer: layer name.
ops: computation amount.
original output shape: output shape of original op.
aligned output shape: output shape of aligned op.
computing cost (no DDR): computation time.
load/store cost: data handling time.
active period of time: the active time period of the compiled layer (does not represent the execution time of the layer, usually multiple layers alternate/execute in parallel).
The purpose of using the hb_perf is to understand the subgraph structure of bin model.
In addition, this tool can also provide comprehensive static analysis indicators.
But the hb_perf doesn’t include the computing evaluation of the CPU part, however, this is not a big deal as long as CPU computations only cover those regular processing at the model input or output parts without those extensive computing nodes. Otherwise you’ll need to utilize some dev board tool to evaluate the actual model performance.
6.3.5.2. Evaluate Actual Model Performance on Dev Board
The hrt_model_exec perf tool is used to evaluate actual model performance on dev board.
The hrt_model_exec is a model execution tool that can evaluate models’ inference performance and obtain model information. On the one hand, it enables users to get models’ actual performance, on the other hand, it helps users to learn the speed limit that the model can achieve, which is a guideline for the target limit of application optimization.
Before using hrt_model_exec perf tool, there are two preparations:
Make sure you have referred to the Environment Deployment to complete the installation of the tools on the development board.
Copy the bin models from your Ubuntu dev machine to the dev board (recommended to put it in the /userdata directory). As there is a Linux operating system on the dev board, you can use some popular Linux commands, such as the
scpto copy the models.
Note
The model used at this time does not need to enable debug, debug enabled will affect the test results of the model on the development board.
The reference command for the actual performance test using hrt_model_exec perf is shown as follows (Note that it is executed on the development board):
./hrt_model_exec perf --model_file mobilenetv1_224x224_nv12.bin \
                      --model_name="" \
                      --core_id=0 \
                      --frame_count=200 \
                      --perf_time=0 \
                      --thread_num=1 \
                      --profile_path="."
Among them, the meaning of each parameter is shown as follows.
Parameter |
Description |
|---|---|
model_file |
The name of the bin model. |
model_name |
This parameter requires the name of the BIN model to be analyzed. Note that the name can be omitted when only one model is specified by the |
core_id |
The default value is |
frame_count |
The default value is |
perf_time |
The default value is |
thread_num |
The default value is |
profile_path |
By default it is off. It is used for specifying the path to generate log. Analysis results will be save into the profiler.log file and the profiler.csv file in specified path. |
You will see the following message at the console after running this command.
As shown below, the Average latency and Frame rate respectively denotes the average single frame inference latency and the limit frame rate of the model. If you want to get the speed limit of model on dev board, you will need to increase the thread_num till it is good enough.
Running condition:
  Thread number is: 4
  Frame count   is: 1000
  Program run time: 279.004000 ms
Perf result:
  Frame totally latency is: 1084.040527 ms
  Average    latency    is: 1.084041 ms
  Frame      rate       is: 3584.178005 FPS
There are only overall messages shown at the console, you can control the profiler.log file and the profiler.csv file
by specifing the profile_path parameter in order to generate more detailed information.
{
  "perf_result": {
    "FPS": 3718.384436330103,
    "average_latency": 1.0366870164871216
  },
  "running_condition": {
    "core_id": 0,
    "frame_count": 1000,
    "model_name": "mobilenetv1_224x224_nv12",
    "run_time": 268.934,
    "thread_num": 4
  }
}
***
{
  "processor_latency": {
    "BPU_inference_time_cost": {
      "avg_time": 0.8493590000000001,
      "max_time": 1.328,
      "min_time": 0.766
    },
    "CPU_inference_time_cost": {
      "avg_time": 0.074976,
      "max_time": 0.382,
      "min_time": 0.066
    }
  },
  "model_latency": {
    "BPU_MOBILENET_subgraph_0": {
      "avg_time": 0.8493590000000001,
      "max_time": 1.328,
      "min_time": 0.766
    },
    "Dequantize_fc7_1_HzDequantize": {
      "avg_time": 0.029727,
      "max_time": 0.124,
      "min_time": 0.028
    },
    "MOBILENET_subgraph_0_output_layout_convert": {
      "avg_time": 0.011379,
      "max_time": 0.077,
      "min_time": 0.008
    },
    "Preprocess": {
      "avg_time": 0.005363000000000001,
      "max_time": 0.039,
      "min_time": 0.003
    },
    "Softmax_prob": {
      "avg_time": 0.028507,
      "max_time": 0.142,
      "min_time": 0.027
    }
  },
  "task_latency": {
    "TaskPendingTime": {
      "avg_time": 0.021235,
      "max_time": 0.336,
      "min_time": 0.002
    },
    "TaskRunningTime": {
      "avg_time": 0.983558,
      "max_time": 2.208,
      "min_time": 0.904
    }
  }
}
The content here corresponds to the bin visualization diagram presented in the BIN Model Structure section
of Use The hb_perf Tool To Evaluate Model Performance . Each node in the diagram has a corresponding node in the profiler.log file, which can be matched by name. The execution time of each node is recorded in the profiler.log file, which is an important reference for optimizing the nodes.
Since the BPU nodes in the model have special requirements for input and output, such as special layout and padding alignment requirements, so the input and output data of the BPU nodes need to be processed.
Preprocess: indicates the padding and layout conversion operation for the model input data, and its time consumption statistics are in Preprocess.xxxx_input_layout_convert: indicates the operation of padding and layout conversion for the input data of BPU nodes, and its time consumption statistics is in xxxx_input_layout_convert.xxxx_output_layout_convert: indicates the operation of removing padding and layout conversion from the output data of the BPU node, and its time consumption statistics is in xxxx_output_layout_convert.
The profiler analysis is a frequently used operation, The previous Interpret Model Check Results section mentioned that the check phase should not focus too much on CPU operators, at this stage, you can see the exact time consumption of the CPU operator.
If the CPU time is considered too long based on the evaluation here, it is worth optimizing.