4.6.2. mem-dump Feature Guide
4.6.2.1. Overview
Introduction
Mem-dump, also known as memory dump, refers to the process of saving the contents of a computer system’s memory (including the operating system, programs, data, etc.) at a specific moment into a file. It is commonly used in scenarios such as fault diagnosis, debugging, and performance analysis.
mem-dump Information
User Space Information
Process Memory Information
Program code and data: Code segments, data segments (e.g., global and static variables), stack, heap memory content of currently running programs.
Stack: The stack stores call information, local variables, return addresses for the current thread. Especially when a program crashes, stack information is crucial for locating the crash point.
Program Counter (PC): Indicates the address of the currently executing instruction, which helps analyze exactly which line of code was being executed when the crash occurred.
Thread Information
Thread stack information: Each thread has an independent stack; memory dumps typically record the stack information for each thread. Thread stacks help debuggers understand the call chain of thread execution.
Thread state: The running state of threads, such as running, waiting, blocked, etc., and whether deadlocks have occurred.
Register Information
CPU registers store the execution state of the program, such as the program counter (PC), stack pointer (SP), base pointer (BP), and general-purpose registers.
Memory Mapping
Process memory mapping: Includes memory regions such as code segment, data segment, heap, shared libraries, and stack. Helps analyze the distribution of process memory.
Kernel Information
Kernel Stack
The kernel stack stores the call chain of kernel functions, typically representing the execution state of the operating system kernel or driver at the time of a crash.
Kernel Modules and Driver Information
Memory dumps record the status of loaded kernel modules and drivers. This helps determine whether a system crash was caused by a specific module or driver.
Loaded modules: Includes device drivers, system services, etc., along with their memory addresses, sizes, and states.
Kernel Data Structures
Memory dumps may also include important kernel data structures such as scheduling queues, process scheduling information, lock states, and file system states.
Kernel Logs and Status Information
The kernel records status information about hardware, drivers, file systems, etc.
Crash Context
Call Stack at Crash (Backtrace)
The call stack (stack trace) is one of the most important pieces of crash analysis information, providing the complete path from the crash point back through the function calls.
Stack Trace at Crash
The stack trace shows the call stack information of all active threads at the time of the crash.
Memory Allocation Information
Some memory dump tools can record memory allocation history, such as memory leaks or excessive allocations.
4.6.2.2. X5 mem-dump Feature Introduction
Feature Highlights
When performing system debugging or reproducing faults, it is necessary to first configure the mem-dump environment (including PC side and board side). Once the system crashes, through a pre-configured panic-action, the development board can enter different boot states or dump the memory image to a specified storage medium.
This allows developers to promptly obtain the memory image after a crash, conduct detailed analysis of the crash scene, quickly identify the root cause of the problem, and provide critical data support for subsequent debugging and performance optimization.
Functional Principle
mem-dump works by reserving a memory region accessible by both uboot and kernel, used as a flag and notification mechanism.
Currently, X5 uses the PMU’s AON STATUS memory region.
| Address | Register | Description |
|---|---|---|
| 0x31021000 | aon_status | Base address of aon_status |
| 0x31021004 | panic-action | panic-action configuration register, indicating the boot state type after panic, with mask 0x0000f000 |
Currently supports 2 boot state types:
| Boot Index | Type | Description | Notes |
|---|---|---|---|
| 0 | normal | Normal kernel boot | Default boot flow |
| 1 | ubootonce | Wait in uboot, normal boot after reset | After crash and reboot, enters uboot command line; user can perform mem-dump operation |
4.6.2.3. mem-dump Configuration
The kernel provides a sysfs interface to get and configure panic action, located at: /sys/kernel/hobot-swinfo/panic_action
Get panic-action
Check the current status value of panic-action.
cat /sys/kernel/hobot-swinfo/panic_action
0: normal
Configure panic-action
Set the panic-action state type.
For example, configuring panic-action to ubootonce:
echo 1 > /sys/kernel/hobot-swinfo/panic_action
4.6.2.4. mem-dump Usage
Configure panic-action
For scenarios requiring the system to remain in the uboot command-line state after reboot, follow the steps below.
Configure panic-action to ubootonce.
echo 1 > /sys/kernel/hobot-swinfo/panic_action
After configuration, upon fault-induced reboot, the system will enter the uboot command line.
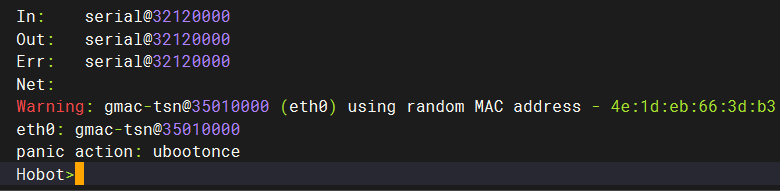
Perform mem-dump to emmc
Execute the following command in uboot to dump memory to the userdata partition of emmc:
memdump userdata
After executing mem-dump, the following files will be generated under the /userdata directory:
cpu-contexts.bin: CPU register information
DDRCS0-0.bin: Memory file below 2GB
DDRCS1-0.bin: Memory file above 2GB (this file exists if more than 2GB of memory is used)
For analysis methods after mem-dump execution, refer to mem-dump Analysis Method
4.6.2.5. mem-dump Analysis Method
mem-dump is parsed using the crash tool. Users need to use software_tools\crash_tool from the SDK delivery package for parsing. The crash_tool package structure is as follows:
├── arm64-regs.so           // arm64 register extension file
├── crash                   // debugging tool
└── parse-cpu-contexts.py   // Python script for parsing CPU register information
Usage steps are as follows:
Parse CPU register information
python3 parse-cpu-contexts.py cpu-contexts.bin >./coreregs.txt
Use crash tool to enter crash context
./crash vmlinux_file ./DDRCS0-0.bin@0x84000000,./DDRCS1-0.bin@0x100000000 --machdep vabits_actual=48
Note: The vmlinux file must match the kernel in the debug firmware and can be obtained from the path out/build/kernel/vmlinux
Load extension file
crash> extend arm64-regs.so
./arm64-regs.so: shared object loaded
Load CPU register information
crash> arm64_core_set -l coreregs.txt
loading cpu core regs from coreregs.txt
loading cpu core regs from coreregs.txt done
System debugging
Example: Print stack information
crash> bt
PID: 957      TASK: ffff0000c6be9c80  CPU: 2    COMMAND: "bash"
 #0 [ffff80000d75bab0] __arm_smccc_smc at ffff800008026e8c
 #1 [ffff80000d75bad0] __invoke_psci_fn_smc at ffff8000087a0f14
 #2 [ffff80000d75bb10] psci_sys_reset at ffff8000087a1338
 #3 [ffff80000d75bb20] atomic_notifier_call_chain at ffff800008068d10
 #4 [ffff80000d75bb60] do_kernel_restart at ffff80000806b2a0
 #5 [ffff80000d75bb70] machine_restart at ffff8000080188f8
PID: 957      TASK: ffff0000c6be9c80  CPU: 2    COMMAND: "bash"
 #0 [ffff80000d75bab0] __arm_smccc_smc at ffff800008026e8c
 #1 [ffff80000d75bad0] __invoke_psci_fn_smc at ffff8000087a0f14
 #2 [ffff80000d75bb10] psci_sys_reset at ffff8000087a1338
 #3 [ffff80000d75bb20] atomic_notifier_call_chain at ffff800008068d10
 #4 [ffff80000d75bb60] do_kernel_restart at ffff80000806b2a0
 #5 [ffff80000d75bb70] machine_restart at ffff8000080188f8
 #6 [ffff80000d75bb90] emergency_restart at ffff80000806a6d4
 #7 [ffff80000d75bba0] panic at ffff800008a9d6ac
 #8 [ffff80000d75bc80] sysrq_handle_crash at ffff8000084fdf98
 #9 [ffff80000d75bc90] __handle_sysrq at ffff8000084fe7e8
#10 [ffff80000d75bce0] write_sysrq_trigger at ffff8000084fee60
#11 [ffff80000d75bd00] proc_reg_write at ffff80000824de70
#12 [ffff80000d75bd20] vfs_write at ffff8000081d0eb0
#13 [ffff80000d75bdc0] ksys_write at ffff8000081d1264
#14 [ffff80000d75be00] __arm64_sys_write at ffff8000081d130c
#15 [ffff80000d75be10] invoke_syscall at ffff800008027014
#16 [ffff80000d75be40] el0_svc_common.constprop.0 at ffff800008027124
#17 [ffff80000d75be70] el0_svc_common.constprop.0 at ffff800008027124
#18 [ffff80000d75be80] do_el0_svc at ffff80000802720c
#19 [ffff80000d75bea0] el0_svc at ffff800008ab21d8
#20 [ffff80000d75bfe0] el0t_64_sync_handler at ffff800008ab25a8
#21 [ffff80000d75bfe0] el0t_64_sync at ffff800008011544
4.6.2.6. Common Issues
panic-action not configured before crash
If panic-action was not configured before the crash, manually boot the development board into uboot. You can still use the command memdump userdata to dump memory to the userdata partition of emmc.
Does configuring panic-action affect reboot or cold boot?
For non-panic reboots, panic-action does not take effect and does not impact the normal boot process.